Strength of a Linear Relationship: The Correlation Coefficient (VCE SSCE General Mathematics): Revision Notes
Strength of a Linear Relationship: The Correlation Coefficient
What is the correlation coefficient?
The correlation coefficient is a numerical measure that tells us how closely the points in a scatterplot cluster around a straight line. When we want to understand the strength of a linear relationship between two variables, we use a specific type of correlation coefficient called Pearson's correlation coefficient, represented by the symbol .
This important statistical measure was developed by a statistician named Carl Pearson. It provides a precise, numerical way to describe the strength of a linear association, rather than relying only on visual inspection of scatterplots.
Carl Pearson (1857-1936) was an English mathematician and biostatistician who made significant contributions to the field of statistics. His correlation coefficient remains one of the most widely used statistical tools today for measuring the strength of linear relationships between variables.
Understanding strength
The strength of a linear association refers to how closely the data points fit a straight line pattern:
- If the points lie exactly on a straight line, we have a perfect linear association
- If the points show no linear pattern at all, we have no association
- Most real-world data falls somewhere in between, showing an imperfect fit
Values of the correlation coefficient
Pearson's correlation coefficient always has a value between and , inclusive. Understanding what these values mean is crucial for interpreting the strength and direction of linear relationships.
Perfect correlations
There are three special cases where the correlation takes exact values:
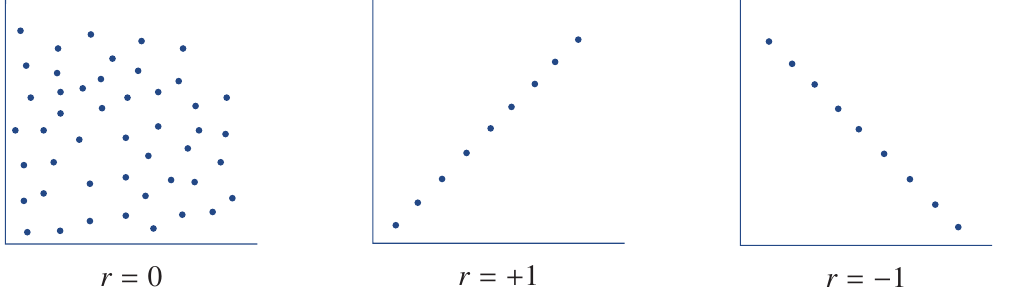
- Perfect positive linear association: When all points fall exactly on an upward-sloping straight line,
- Perfect negative linear association: When all points fall exactly on a downward-sloping straight line,
- No linear association: When the points show a random scatter with no linear pattern,
The Three Perfect Values to Remember:
- means all points lie exactly on an upward-sloping straight line
- means all points lie exactly on a downward-sloping straight line
- means there is no linear pattern in the data
These are the only values where we can describe the relationship as "perfect"!
Imperfect correlations
Most real-world data shows imperfect linear associations, where the correlation coefficient falls between the perfect values. This means . The closer is to or , the stronger the linear relationship. The closer is to , the weaker the relationship.
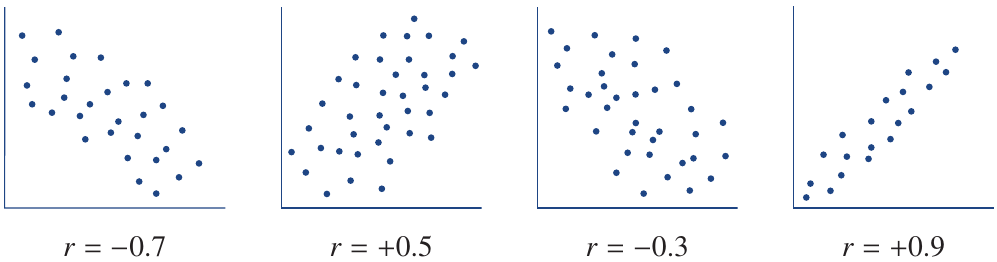
The scatterplots above show examples of different correlation strengths:
- shows a moderately strong negative relationship
- shows a moderate positive relationship
- shows a weak negative relationship
- shows a very strong positive relationship
Properties of Pearson's correlation coefficient
The Pearson's correlation coefficient has several important properties that make it useful for analysing linear relationships:
- Measures strength: It quantifies how strong a linear association is, with larger absolute values (closer to or ) indicating stronger relationships
- Range: The value is always between and , inclusive
- Sign indicates direction:
- is positive when the linear association has a positive direction (as one variable increases, the other tends to increase)
- is negative when the linear association has a negative direction (as one variable increases, the other tends to decrease)
- Zero indicates no linear relationship: When is close to zero, there is no linear association between the variables
The magnitude (absolute value) of tells you about the strength of the relationship, while the sign tells you about the direction. For example, and both indicate equally strong relationships, but in opposite directions!
The correlation coefficient formula
Pearson's correlation coefficient can be calculated using a specific formula. While you'll typically use a calculator to find , understanding the formula helps you appreciate what the correlation coefficient actually measures.
If we call our two variables and , and we have observations (data points), then:
In this formula:
- is the mean (average) of the -values
- is the standard deviation of the -values
- is the mean of the -values
- is the standard deviation of the -values
- is the number of observations
- means "sum of"
Understanding the Formula:
The numerator measures how and vary together. When both variables tend to be above or below their means together, this sum is large and positive. When one is above its mean while the other is below, the sum becomes negative.
The denominator standardises this measure by accounting for the spread in both variables, producing a value that always falls between and .
Calculating the correlation coefficient manually
Whilst calculators make finding correlation coefficients quick and easy, working through a manual calculation once helps you understand what the correlation coefficient represents.
Worked Example: Manual Calculation of Correlation Coefficient
Let's calculate the correlation coefficient for this dataset:
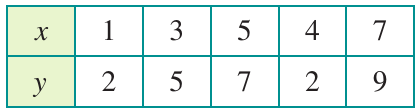
Given information:
- ,
- ,
Step 1: Write down all the given values
We have: , , , , and
Step 2: Set up a table to calculate
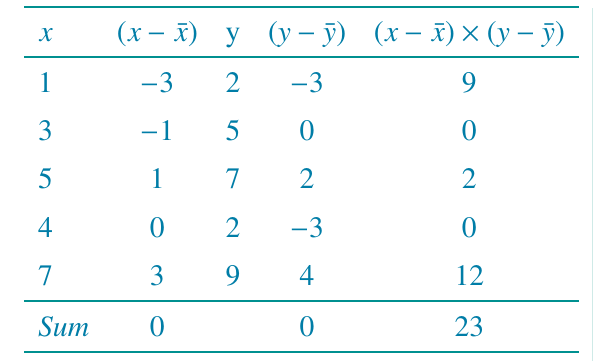
For each data point, we:
- Calculate by subtracting the mean from each -value
- Calculate by subtracting the mean from each -value
- Multiply these deviations together to get
- Sum all the products
From the table:
Step 3: Substitute into the formula and calculate
Answer: The correlation coefficient is , indicating a strong positive linear association between the variables.
Using technology to find the correlation coefficient
Modern calculators can compute correlation coefficients quickly and accurately, saving time and reducing calculation errors. Here's how to use a TI-Nspire CAS calculator to find the correlation coefficient for real-world data.
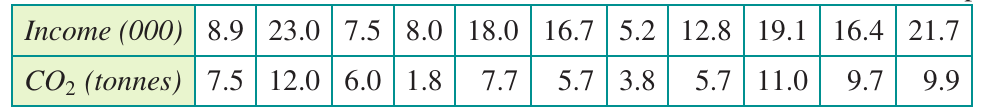
Worked Example: Income and CO₂ Emissions Using Technology
The following data shows the per capita income (in thousands of dollars) and per capita carbon dioxide emissions (in tonnes) for 11 countries:
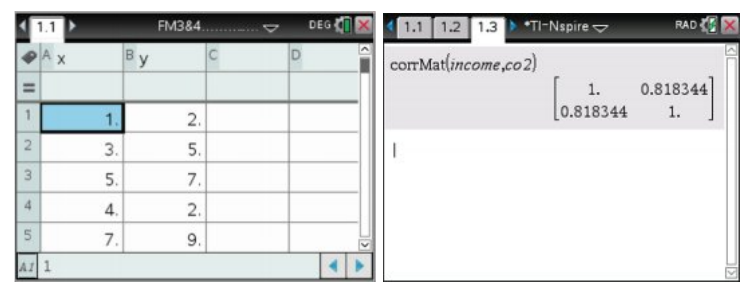
Using a TI-Nspire CAS calculator:
Step 1: Start a new document by pressing ctrl + N
Step 2: Select "Add Lists & Spreadsheet" and enter the data into lists named income and co2
Step 3: Press ctrl + I and select "Add Calculator"
Step 4: Use the correlation matrix command by typing:
corrmat(income, co2)
Then press enter.
Alternatively, press ctrl + T then C to access the Catalogue, scroll to corrMat( and complete the command.
Result: The correlation coefficient is or (to 2 decimal places)
Interpretation: This strong positive correlation suggests that countries with higher per capita incomes tend to have higher carbon dioxide emissions.
Classifying the strength of a linear association
Once you've calculated a correlation coefficient, you need to interpret what it means. We classify correlations based on their value to describe the strength of the relationship in words.
Classification table
The following table provides a standard system for classifying the strength and direction of linear associations based on the correlation coefficient value.
Correlation Classification Guidelines
| Range of | Classification |
|---|---|
| Strong positive association | |
| Moderate positive association | |
| Weak positive association | |
| No association | |
| Weak negative association | |
| Moderate negative association | |
| Strong negative association |
Key points:
- Values closer to indicate stronger relationships
- The sign (positive or negative) indicates the direction
- Values near zero suggest little to no linear relationship
Worked examples of classification
Let's practice classifying correlation coefficients using the classification table.
Worked Examples: Classifying Correlation Strength
Example a:
The value falls in the range
Classification: Weak, positive association
Example b:
The value falls in the range
Classification: Moderate, negative association
Example c:
The value falls in the range
Classification: Strong, positive association
Example d:
The value falls in the range
Classification: No association
Note: Even though this value is negative, it's so close to zero that we classify it as having no meaningful linear association.
Important considerations and warnings
The correlation coefficient is a powerful tool, but it must be used appropriately. There are important conditions that must be met before using to measure the strength of an association.
When to use the correlation coefficient
You should only use Pearson's correlation coefficient as a measure of association strength when the following three conditions are met:
Three Essential Conditions for Using Correlation Coefficient
1. The variables are numeric
The correlation coefficient requires numerical data for both variables. It cannot be used with categorical data (like colours or types of animals).
2. The association is linear
The correlation coefficient specifically measures linear relationships. If the relationship between variables follows a curve or other non-linear pattern, will not accurately reflect the strength of that relationship.
3. There are no outliers in the data
Outliers (data points that are very different from the rest) can dramatically affect the correlation coefficient. The presence of outliers can give a misleading indication of the strength of the linear association. Always check for outliers in your scatterplot before relying on the correlation coefficient.
Warning: Using the correlation coefficient when these conditions aren't met can lead to incorrect conclusions about the relationship between variables!
Exam Tip: Finding and Interpreting Correlation Coefficients
When asked to find and interpret a correlation coefficient in an exam:
- Always check the scatterplot first to ensure the relationship appears linear
- Calculate using your calculator
- Use the classification table to describe the strength
- Always include both the strength (weak/moderate/strong) and direction (positive/negative) in your answer
- If there are outliers, mention that they may be affecting the correlation coefficient
A complete answer might look like: "The correlation coefficient is , indicating a strong positive linear association between the variables."
Remember!
Key Points to Remember:
-
The correlation coefficient measures the strength of a linear relationship between two variables, with values ranging from to
-
Perfect correlations occur at the extremes: (perfect positive), (perfect negative), and (no linear relationship)
-
The sign of tells you the direction: positive values mean positive associations (both variables increase together), whilst negative values mean negative associations (one variable increases as the other decreases)
-
The magnitude (absolute value) tells you the strength: values closer to or indicate stronger linear relationships, whilst values closer to indicate weaker relationships
-
Only use correlation coefficients when:
- Variables are numeric
- The association is linear
- There are no significant outliers Otherwise the correlation coefficient can be misleading
-
Use the classification table to describe correlation as weak, moderate, or strong, and always include both strength and direction in your interpretation