Smoothing a Time Series Plot Using Moving Medians (VCE SSCE General Mathematics): Revision Notes
Smoothing a Time Series Plot Using Moving Medians
Introduction to moving median smoothing
Moving median smoothing is a straightforward and practical technique for smoothing time series data. This method has a key advantage: you can work directly with the graph rather than needing precise numerical values for every data point.
The main benefit of moving median smoothing is that it can be performed graphically without requiring exact numerical values for each data point. This makes it particularly useful when working with hand-drawn graphs or when precise measurements are difficult to obtain.
Before we can smooth a time series using moving medians, we first need to understand how to locate medians graphically. In this course, median smoothing uses only odd numbers of points (such as 3 or 5), which means centring is not required.
Locating medians graphically
When you have several data points plotted on a coordinate plane, you can find their median point by following a systematic three-step process. The median point represents the central position of the data set in both the horizontal and vertical directions.
Let's work through an example with three data points to understand the process.
Worked Example: Finding the Median Point of Three Data Points
Suppose we have three data points plotted on a coordinate plane. We'll use the three-step graphical method to locate their median point.
Step 1: Find the middle x-value
Examine your data points and identify which point lies in the middle when looking along the x-axis (the horizontal direction). Draw a vertical line through this middle x-value.
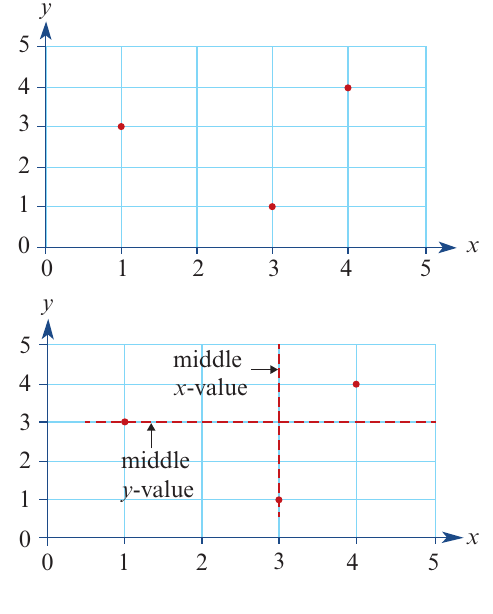
Step 2: Find the middle y-value
Now look at your data points in the y-direction (vertically). Identify which point has the middle y-value among all your points. Draw a horizontal line through this middle y-value.
Step 3: Locate the median point
The median point is located where your two lines intersect. Mark this intersection point with a cross (×). This point represents the median of your data set.
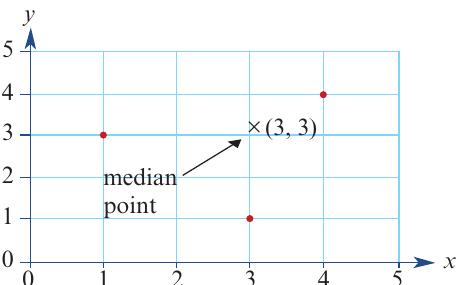
In the example shown, the median point is located at coordinates . This point has the middle x-value and the middle y-value of all the data points.
Smoothing a time series using three-median smoothing
Once you understand how to find a median point graphically, you can apply this technique to smooth an entire time series plot. The process involves finding the median for consecutive groups of three data points.
Three-median smoothing process
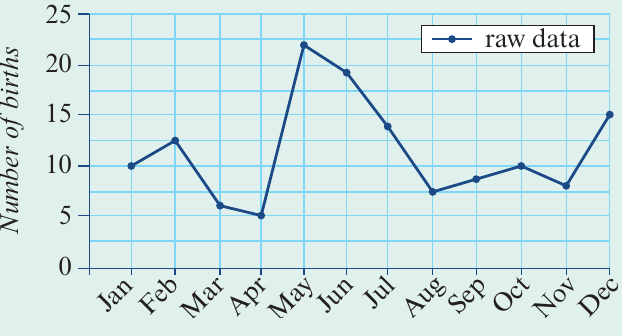
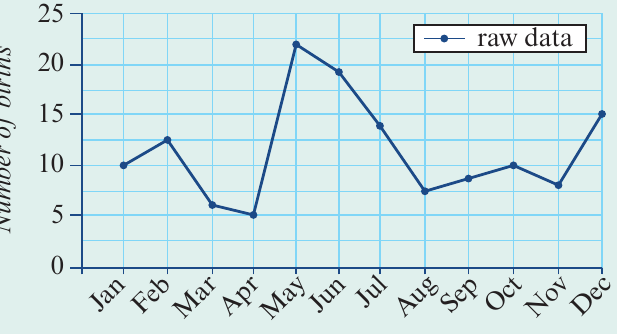
Consider the following time series showing monthly birth data:
To create a three-median smoothed plot, follow these steps:
Worked Example: Three-Median Smoothing of Birth Data
We'll apply three-median smoothing to smooth out the monthly birth data shown above.
Step 1: Start with the first three consecutive data points (January, February, March). Using the graphical method described above, find the middle month along the x-axis and the middle number of births along the y-axis. Mark the median point where these values intersect.
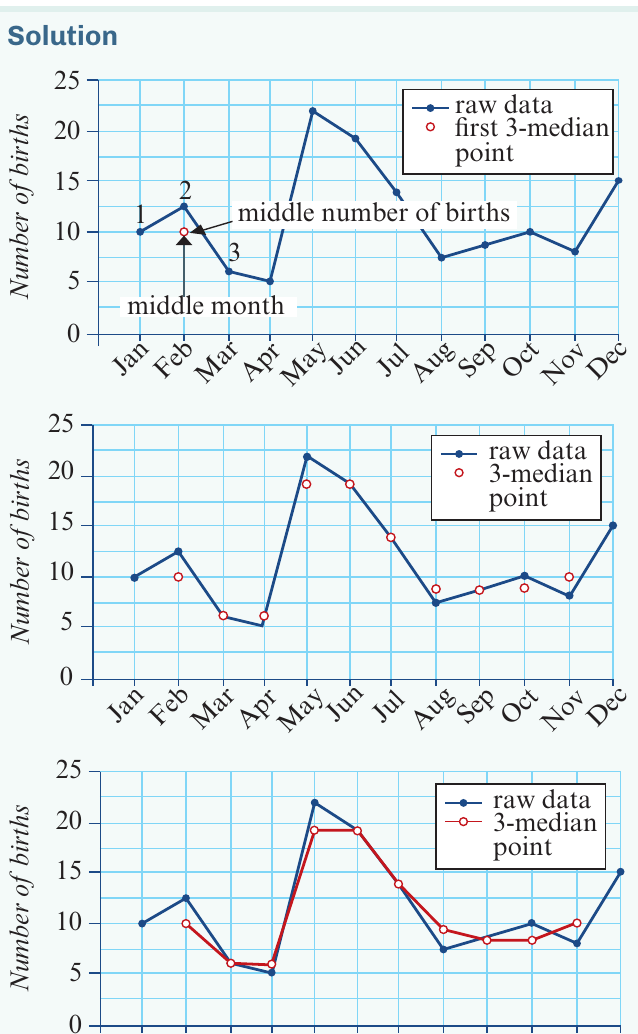
Step 2: Move to the next group of three consecutive points (February, March, April). Find and mark the median point for this group using the same method.
Step 3: Continue this process, moving one point at a time and finding the median of each group of three consecutive points. You'll keep doing this until you run out of groups of three points.
Step 4: Connect all the median points you've marked with straight line segments. This creates your smoothed plot.
Notice how the smoothed line (shown with circles) follows the general trend of the raw data but eliminates some of the short-term fluctuations. The smoothed plot gives a clearer picture of the underlying pattern in the data.
Smoothing a time series using five-median smoothing
Five-median smoothing follows the same principle as three-median smoothing, but uses groups of five consecutive data points instead of three. This produces an even smoother result.
Five-median smoothing process
Using the same birth data as before, let's apply five-median smoothing:
Worked Example: Five-Median Smoothing of Birth Data
We'll now apply five-median smoothing to the same monthly birth data to see the difference.
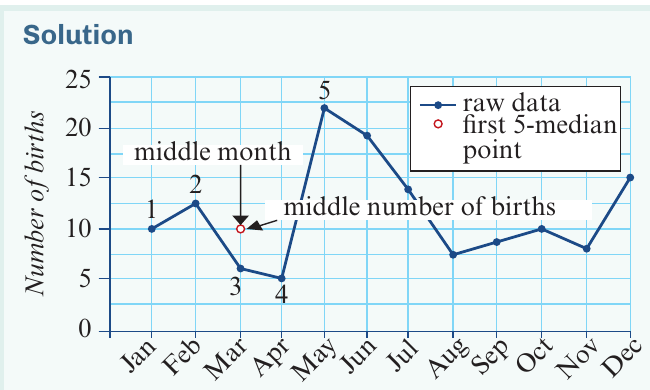
Step 1: Begin with the first five consecutive data points (January, February, March, April, May). Identify the middle month (the third month, which is March) and the middle number of births (the third value when all five are arranged in order). Mark the median point where these intersect.
Step 2: Move to the next group of five consecutive points (February, March, April, May, June). Find and mark the median point for this group.
Step 3: Continue moving one point at a time, finding the median of each group of five consecutive points until you can no longer form complete groups of five.
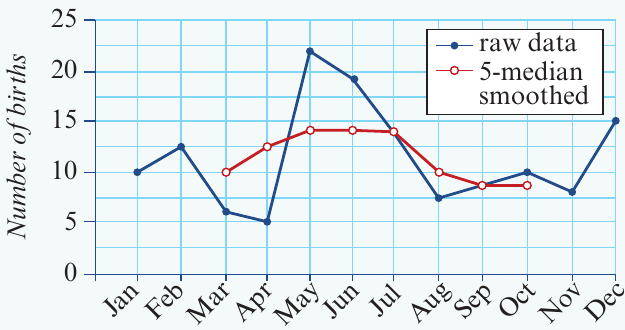
Step 4: Connect all the median points with line segments to create the smoothed plot.
Comparing three-median and five-median smoothing
An important observation: the five-median smoothed plot is much smoother than the three-median smoothed plot. This is because averaging over more points reduces the impact of individual fluctuations in the data.
When choosing between three-median and five-median smoothing:
- Use three-median smoothing when you want to preserve more detail in the data while still reducing noise
- Use five-median smoothing when you want to identify longer-term trends and are less concerned about short-term variations
Both methods will reduce the number of smoothed data points compared to the original raw data. For example, if you start with 12 monthly data points and use five-median smoothing, you'll end up with 8 smoothed points (since you need 5 consecutive points to create each median point).
Exam tips
Key Points for Exam Success:
When smoothing a time series plot using moving medians:
- Always work systematically, moving one data point at a time
- Use a ruler to draw neat vertical and horizontal lines through your middle values
- Mark median points clearly with a cross or circle
- Remember that you cannot create smoothed points at the very start and end of the data series (you need enough points on either side)
- Five-median smoothing will give fewer smoothed points than three-median smoothing
- Show your working clearly by indicating which points you're using for each median calculation
Remember!
Key Points to Remember:
- Moving median smoothing allows you to smooth time series data directly on a graph without needing exact numerical values
- To find a median point graphically: draw a vertical line through the middle x-value, a horizontal line through the middle y-value, and mark where they intersect
- Three-median smoothing uses consecutive groups of three data points and preserves more detail
- Five-median smoothing uses consecutive groups of five data points and produces a much smoother result
- The smoothed plot always has fewer data points than the original raw data
- This method only uses odd numbers of points (3, 5, etc.), so centring is not required