Smoothing a Time Series Using Moving Means (VCE SSCE General Mathematics): Revision Notes
Smoothing a Time Series Using Moving Means
Introduction to smoothing
When analysing time series data, we often encounter various sources of variation including trends, cycles, seasonality, structural changes, outliers, and irregular fluctuations. These variations, particularly irregular fluctuations and seasonality, can make it difficult to identify underlying trends in the data. Smoothing is a statistical technique used to overcome this problem by reducing the impact of these short-term fluctuations.
Moving mean smoothing is a method that involves replacing individual data points in a time series with the average (mean) of that data point and some of its neighbouring points. This process helps to "smooth out" random variations and makes trends easier to see. The simplest approach is to smooth over a small odd number of data points, such as three or five, though any number of points can be used depending on the needs of your analysis.
The moving mean technique is particularly useful when you need to identify long-term trends in data that contains significant short-term variation. By averaging neighbouring points, you create a more stable representation of the underlying pattern.
The three-moving mean
The three-moving mean is the simplest form of moving mean smoothing. To apply this method, you replace each data value with the average of three consecutive values: the data point itself, plus the value immediately before it and the value immediately after it.
Formula:
where , , and are three sequential data values in the time series.
The first and last points in your time series cannot be smoothed using this method because they don't have values on both sides. These endpoints are therefore omitted from the smoothed data series.
Worked example: Three-moving mean
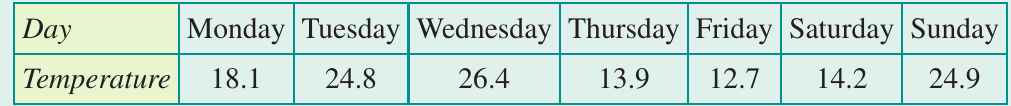
Let's look at temperature data recorded at a weather station at 9:00 a.m. each day for a week:
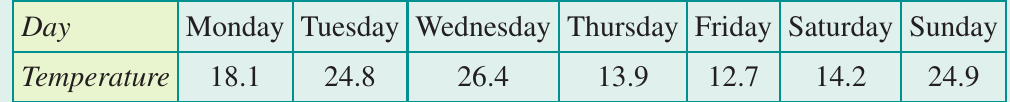
Worked Example: Calculating the Three-Moving Mean
Question: Calculate the three-moving mean smoothed temperature for Tuesday.
Solution:
First, identify the three temperatures centred on Tuesday:
- Monday:
- Tuesday:
- Wednesday:
Then calculate their mean:
Therefore, the three-moving mean smoothed temperature for Tuesday is .
The five-moving mean
The five-moving mean works on the same principle as the three-moving mean, but uses five consecutive values instead. You replace each data value with the average of five values: the data point itself, plus the two values immediately before it and the two values immediately after it.
Formula:
where , , , , are five sequential data values in the time series.
The first two and last two points in your time series cannot be smoothed using this method because they don't have two values on each side. These points are omitted from the smoothed data series.
Worked example: Five-moving mean
Using the same temperature data from the previous example:
Worked Example: Calculating the Five-Moving Mean
Question: Calculate the five-moving mean smoothed temperature for Thursday.
Solution:
First, identify the five temperatures centred on Thursday:
- Tuesday:
- Wednesday:
- Thursday:
- Friday:
- Saturday:
Then calculate their mean:
Therefore, the five-moving mean smoothed temperature for Thursday is .
Smoothing a complete time series
When smoothing an entire time series, you apply the moving mean calculation to every possible data point. The table below demonstrates how to calculate both three-moving mean and five-moving mean values for monthly birth data at a country hospital:
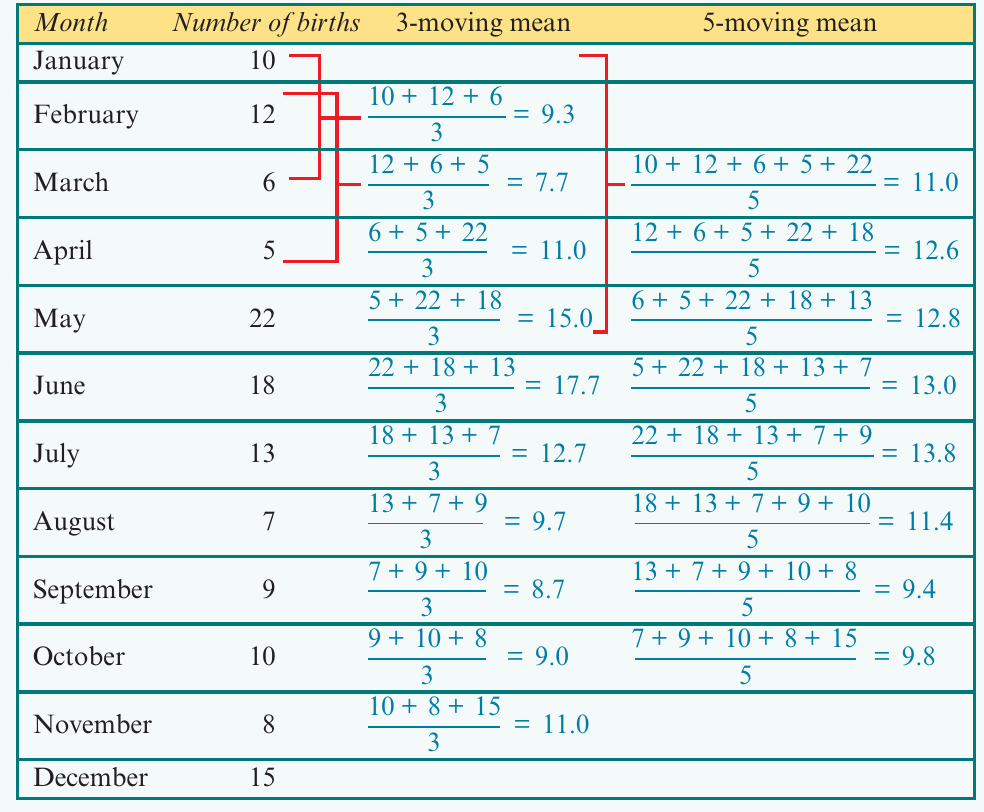
Notice how the calculations work:
- For the three-moving mean, we lose the first and last data points (January and December)
- For the five-moving mean, we lose the first two and last two data points (January, February, November, and December)
- Each smoothed value is calculated by taking the mean of the specified number of consecutive values
Comparing smoothing methods
The graph below shows the original (raw) data alongside both the three-moving mean and five-moving mean smoothed data:
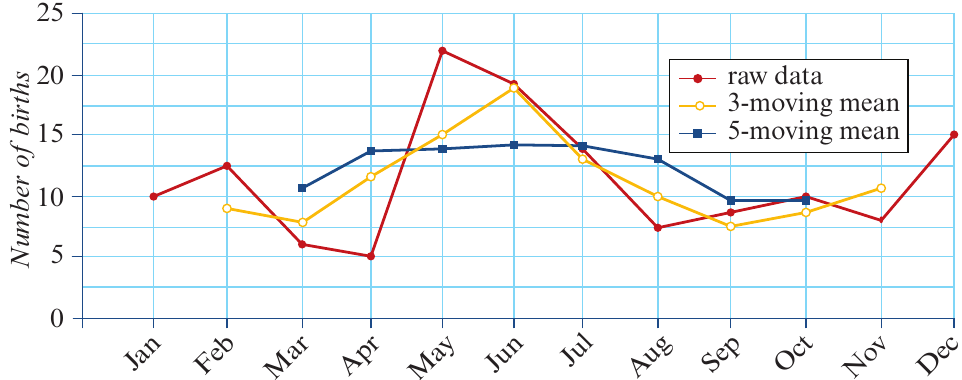
From this visualization, we can observe two important points:
1. Greater smoothing with more data points: The five-moving mean produces a smoother line than the three-moving mean. This is because averaging over more data points reduces the impact of any single unusual value, resulting in a more stable trend line.
2. Revealing the true trend: While the raw data might suggest an increasing trend, the five-moving mean smoothed plot reveals there is actually no clear trend. This demonstrates how smoothing can help us see the underlying pattern more clearly by removing the "noise" from irregular fluctuations.
Trade-off: Remember that the more data points you include in your moving mean, the more data points you lose at the beginning and end of your series. This is an important consideration when choosing your smoothing method.
Moving mean smoothing with centring
When we smooth using an even number of data points (such as 2, 4, or 6), we encounter a problem: the centre of the set of points doesn't align with any actual time point in our original series. Instead, the calculated mean falls between two time points. To solve this problem, we use a technique called centring.
Centring involves taking a two-moving mean of the already smoothed values. This extra step ensures that our smoothed values line up properly with the original data points.
Centring is only required when smoothing using an even number of data values. Odd-numbered moving means do not require centring as they naturally align with the central data point.
Two-moving mean with centring
Let's understand the centring process using a simple example with three days of temperature data:
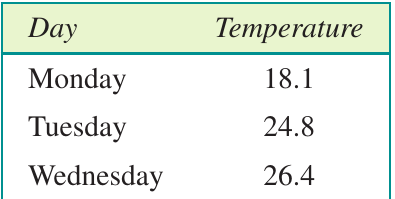
When we calculate consecutive two-moving means for this data, we get:
- Mean of Monday and Tuesday:
- Mean of Tuesday and Wednesday:
The problem is that these means fall between the days rather than on specific days. The diagram below illustrates this:
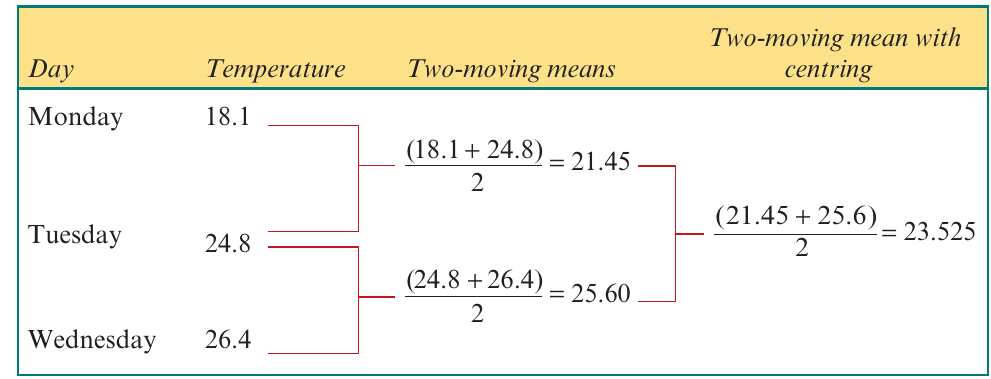
To centre these values on Tuesday, we take the average of the two means:
Now we have a smoothed value that properly aligns with Tuesday.
Worked example: Two-moving mean with centring
Using the complete week of temperature data:
Worked Example: Two-Moving Mean with Centring
Question: Calculate the two-moving mean smoothed temperature with centring for Tuesday.
Solution:
Step 1: Identify the three data values centred on Tuesday:
- Monday:
- Tuesday:
- Wednesday:
Step 2: Calculate the mean of the first two values (mean 1) and the mean of the second two values (mean 2):
Step 3: Calculate the centred mean by averaging mean 1 and mean 2:
Step 4: Round to one decimal place:
Therefore, the two-moving mean smoothed temperature for Tuesday is .
Four-moving mean with centring
The process for smoothing with larger even numbers follows the same principles as two-moving mean smoothing, but uses larger groups of values.
Worked Example: Four-Moving Mean with Centring
Using the weekly temperature data, calculate the four-moving mean smoothed temperature with centring for Thursday.
Step 1: For four-mean smoothing with centring, identify the five data values centred on Thursday:
- Tuesday:
- Wednesday:
- Thursday:
- Friday:
- Saturday:
Step 2: Calculate the mean of the first four values (mean 1) and the mean of the last four values (mean 2):
Step 3: Calculate the centred mean:
Step 4: Write the final answer:
The four-moving mean smoothed temperature centred on Thursday is (to 1 decimal place).
Six-moving mean with centring
For six-moving mean smoothing with centring, follow the same process but use seven data values.
Worked Example: Six-Moving Mean with Centring
Calculate the six-moving mean smoothed temperature with centring for Thursday.
Step 1: Identify the seven data values centred on Thursday (all seven days):
- Monday:
- Tuesday:
- Wednesday:
- Thursday:
- Friday:
- Saturday:
- Sunday:
Step 2: Calculate mean 1 (first six values) and mean 2 (last six values):
Step 3: Calculate the centred mean:
Step 4: Final answer:
The six-moving mean smoothed temperature centred on Thursday is (to 1 decimal place).
Smoothing a complete time series with centring
When applying four-moving mean smoothing with centring to an entire time series, it's helpful to organize your work in a table format. This keeps track of all the intermediate calculations. Here's an example using monthly birth data from a country hospital:
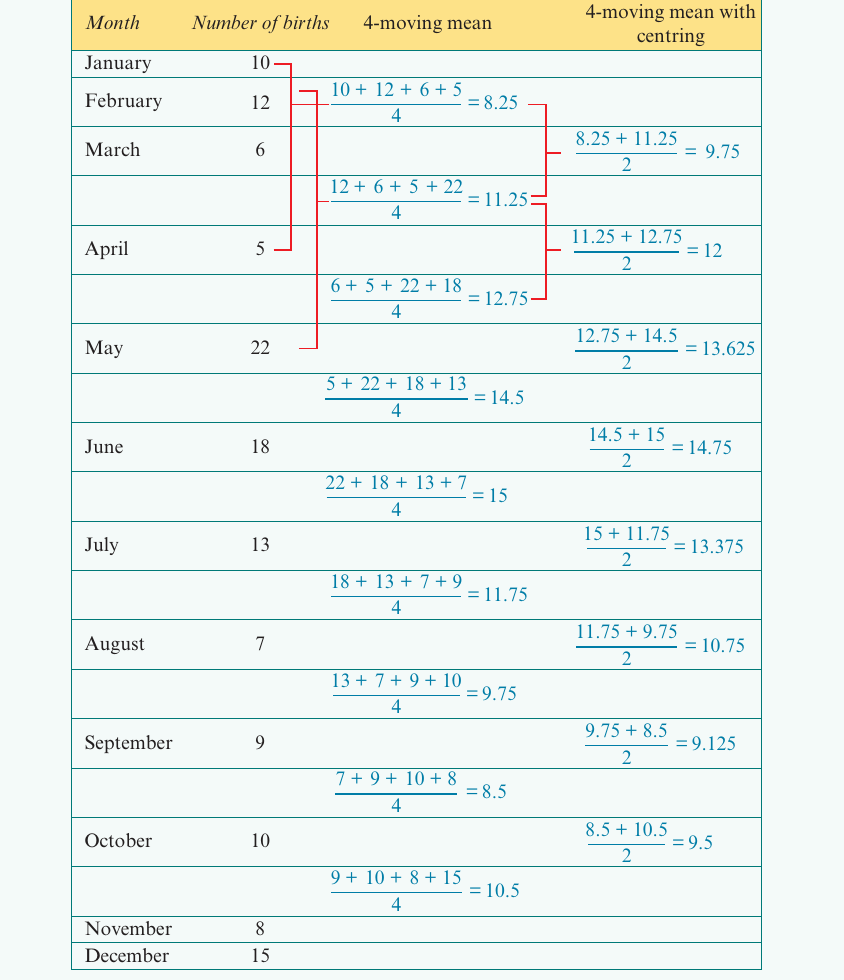
The table shows:
- Column 1: The month
- Column 2: Number of births (raw data)
- Column 3: Four-moving means (averaging groups of four consecutive months)
- Column 4: Centred four-moving means (averaging consecutive pairs from column 3)
Notice that:
- The first smoothed centred value appears in March (we lose January and February)
- The last smoothed centred value appears in October (we lose November and December)
- Each centred value properly aligns with a specific month
This approach provides a systematic way to smooth an entire time series while maintaining proper alignment with the original time periods.
Exam tips
When choosing a smoothing method:
- Use odd-numbered moving means (3, 5, 7, etc.) when you want simple calculations without centring
- Use even-numbered moving means (2, 4, 6, etc.) when the seasonal pattern matches (e.g., 4-moving mean for quarterly data, 12-moving mean for monthly data with yearly patterns)
- Remember: larger moving means produce smoother results but lose more data points at the ends
Key things to remember:
- Always clearly identify which data values you need before calculating
- Show your working step by step, especially the calculation of mean 1 and mean 2 for centring
- Round only at the final step to maintain accuracy
- State your final answer with appropriate units and rounding
Common mistakes to avoid:
- Forgetting to centre when using even-numbered moving means
- Using the wrong number of data values (e.g., using 4 values when you need 5 for four-mean with centring)
- Losing track of which values belong to which calculation in longer series
Remember!
Key Points to Remember:
- Smoothing reduces irregular fluctuations and seasonality to reveal underlying trends in time series data
- Odd-numbered moving means (3, 5, 7, etc.) are straightforward—just average the specified number of consecutive values centred on each point
- Even-numbered moving means (2, 4, 6, etc.) require centring—an extra step of taking a two-moving mean of the already smoothed values
- More smoothing (using more data points) produces a more stable trend line but causes you to lose more data points at the beginning and end of your series
- Always organize your work systematically, especially when smoothing complete time series, to keep track of all calculations