Expected Value (Mean), Variance, and Standard Deviation (VCE SSCE Mathematical Methods): Revision Notes
Expected Value (Mean), Variance, and Standard Deviation
Introduction to population parameters
When we calculate the mean, variance, and standard deviation from a set of data, these are called sample statistics. However, we can also calculate the theoretical values of these measures using the probability distribution of a random variable. When calculated from the probability distribution, they are called population parameters. This section explores how to determine these parameters.
The key difference between sample statistics and population parameters:
- Sample statistics are calculated from actual data you've collected
- Population parameters are theoretical values calculated from the probability distribution
- Population parameters tell us what we would expect to see in the long run
Expected value (mean)
What is expected value?
The expected value of a random variable is the theoretical mean calculated from its probability distribution. It's also called the mean of the random variable and is denoted by (the Greek letter mu) or .
The expected value represents the long-run average value we would expect to observe if we repeated an experiment many times. It's not necessarily a value that the random variable can actually take in any single trial, but rather the average outcome over many trials.
Historical Context
The concept of expected value originated in gambling problems, where gamblers wanted to know their expected winnings or losses over the long run to decide whether a game was worth playing.
Formula for expected value
For a discrete random variable , the expected value is calculated by summing the products of each possible value and its probability:
This means we multiply each value by its probability, then add all these products together.
Worked Example: Lucky Ticket Game
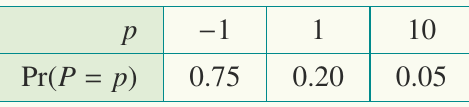
Problem: A person buys a lucky ticket for $1. They have a 20% chance of winning $2, a 5% chance of winning $11, and otherwise they lose. How much could you expect to win (or lose) per game in the long run?
Solution:
Let be the profit from each game. Since it costs $1 to play:
- Lose $1 (which means ) with probability
- Win $1 profit (which means ) with probability
- Win $10 profit (which means ) with probability
If you played the game 1000 times, you would expect to:
- Lose $1 about 750 times
- Win $1 about 200 times
- Win $10 about 50 times
Your total winnings would be approximately:
Therefore, .
Interpretation: In the long run, you would expect to lose about 5 cents per game. This doesn't mean you'll lose 5 cents in any single game (you can't!), but on average, this is your expected loss per game over many plays.
Worked Example: Biased Coin
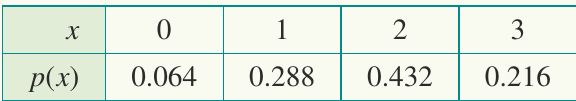
Problem: A coin is biased in favour of heads such that the probability of obtaining a head on any single toss is . The coin is tossed three times and the results noted. If is the number of heads obtained on the three tosses, find , the expected value of .
Solution:
First, we need to determine the probability distribution of by listing all possible outcomes:
Now we can calculate the expected value:
Interpretation: If we repeated this experiment many times, we would observe an average of 1.8 heads per three tosses.
Expected value of a function of X
Sometimes we need to find the expected value of a function of X rather than itself. To do this, we calculate the value of the function for each value of , then sum the products of these values and their associated probabilities.
The expected value of is given by:
Worked Example: Functions of X
Using the random variable from the previous example (biased coin), let's find:
Solution:
Part a: Finding
We calculate for each value of :
- When :
- When :
- When :
- When :
Part b: Finding
Important property: Expected value is not generally equal to the function of expected value
Comparing these results with from the previous example:
For part a: and , so E(3X + 1) = 3E(X) + 1 ✓
For part b: but , so ✗
Critical Property to Remember
In general, the expected value of a function of is NOT equal to that function of the expected value of :
The exception is when the function is linear.
This is a common mistake - students often assume that E of the square equals the square of E, but this is false:
Properties of expected value
Linear transformation property
For a linear function of :
This property is very useful for calculations because it allows us to split the expected value of a linear transformation into simpler parts.
Understanding the Linear Property
This property tells us that:
- Expected value "distributes" over addition and multiplication by constants
- We can factor out constants from the expected value
- This makes many calculations much easier than working from the definition
Sum property
The expected value of the sum of two random variables equals the sum of their expected values:
Worked Example: TV Repair Company
Problem: For a $5 monthly fee, a TV repair company guarantees customers a complete service. The company estimates:
- Probability of one service call in a month:
- Probability of two calls:
- Probability of three or more calls:
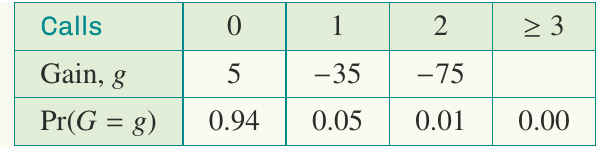
Each call costs the company $40. What is the company's expected monthly gain from such a contract?
Solution:
Let's set up the probability distribution. If is the gain:
- 0 calls: Gain = $5, Probability =
- 1 call: Gain = $5 - 40 = -$35, Probability =
- 2 calls: Gain = $5 - 80 = -$75, Probability =
- 3+ calls: Probability =
Method 1: Direct calculation
Method 2: Using the linear transformation property
Let be the number of calls received. Then:
Using the property :
First, calculate :
Therefore:
Interpretation: The company can expect to gain $2.20 per month on each contract sold.
Comparing the Two Methods
Notice how Method 2 is often easier:
- We only needed to find , which involved fewer calculations
- The linear transformation property simplified the work
- Both methods give the same answer, but Method 2 is more efficient
Variance and standard deviation
What is variance?
The variance of a random variable measures how spread out the probability distribution is around its mean. It tells us how far, on average, the values of are from the expected value.
The variance is denoted by or (where is the lowercase Greek letter sigma).
Definition:
This can be written as:
The variance represents the long-run average value of the square of the distance from to .
Why Square the Differences?
We square the differences because:
- Positive and negative deviations would cancel out if we didn't square them
- Squaring emphasizes larger deviations
- It gives us a mathematically useful measure of spread
What is standard deviation?
Because variance involves squaring, it's measured in squared units. To get a measure of spread in the same units as the original random variable, we take the square root of the variance.
The standard deviation is defined as:
The standard deviation is usually denoted by .
Computational formula for variance
While the definition is conceptually important, there's an easier formula for calculating variance:
This is the Formula You'll Actually Use
The computational formula is much easier to work with than the definition. You need to:
- Calculate and square it to get
- Calculate separately
- Subtract:
Remember: E of the square MINUS the square of E
Proof:
Starting from the definition:
Using the property :
Since :
Worked Example: Calculating Variance and Standard Deviation
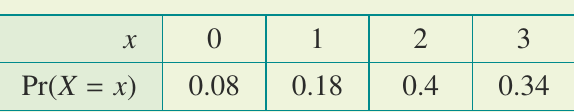
Problem: For the probability distribution shown below, find and , and hence find the variance and standard deviation of .
Solution:
Step 1: Calculate
Therefore,
Step 2: Calculate
Step 3: Calculate variance
Step 4: Calculate standard deviation
Variance of linear transformations
Just as expected value has special properties for linear transformations, so does variance.
Key Observations About Variance Transformations
- Multiplying by a constant multiplies the variance by (the square of the constant)
- Adding a constant does NOT change the variance because it doesn't change the spread - it just shifts all values equally
- This means
Remember the mnemonic: "Variance squares the constant"
Key Formulas and Properties to Remember
Expected Value:
- Formula: , denoted by
- Function of X:
- Linear transformation:
- Sum property:
- Important: In general, , except when is linear
Variance and Standard Deviation:
- Variance (definition): , denoted by
- Variance (computational formula):
- Standard deviation: , denoted by
- Variance of linear transformation:
Key Concepts:
- The expected value represents the long-run average, not the outcome of a single trial
- Variance measures spread about the mean; adding constants doesn't change spread, but multiplying does
- Remember: E of the square is NOT the square of E: