Relations, Domain and Range (VCE SSCE Mathematical Methods): Revision Notes
Relations, Domain and Range
What is a relation?
In mathematics, we often work with pairs of numbers that are related to each other. These pairs form what we call relations.
An ordered pair is written as , where is the first coordinate and is the second coordinate. The order matters - is different from .
A relation is a collection of ordered pairs. We can think of it as a set of coordinate points that have some connection or pattern.
For example:
Both and are relations because they are sets of ordered pairs.
Domain and range
Every relation has two important sets associated with it: the domain and the range.
The domain is the set of all first coordinates (x-values) from the ordered pairs. Think of it as all the possible inputs or x-values that appear in the relation.
The range is the set of all second coordinates (y-values) from the ordered pairs. This represents all the possible outputs or y-values in the relation.
Example: Finding Domain and Range
For the relation :
- Domain of
- Range of
For the relation :
- Domain of
- Range of
Notice that we only list each value once in the domain or range, even if it appears multiple times in the ordered pairs.
Representing relations
Relations can be expressed and visualised in several different ways. Each representation gives us the same information but in a different format.
Listed sets of ordered pairs
The simplest way to write a relation is as a list of ordered pairs, as we saw above. However, this is only practical when we have a finite number of pairs.
Rules with specified domains
Many relations can be described using a rule or equation. For example, the relation:
This notation means "the set of all ordered pairs where and belongs to the set ".
When we evaluate this rule for each x-value, we get:
The domain is and the range is .
To fully define a relation using a rule, we must specify both the equation and the domain. Without the domain, we don't know which ordered pairs to include.
Graphing relations
We can represent relations visually by plotting them on Cartesian axes (an x-y coordinate plane).
Discrete relations: When the domain contains only specific values (like ), we plot individual points.
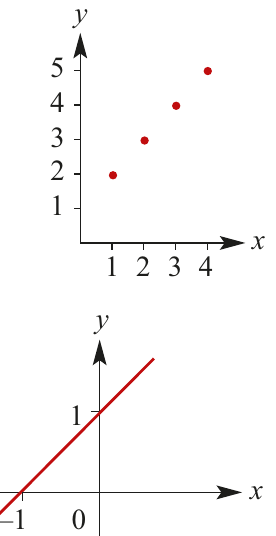
The top panel shows the discrete relation as four separate points. The bottom panel shows what happens when the domain is all real numbers - we get a continuous line instead.
Continuous relations: When the domain is an interval or all real numbers (), the graph becomes a continuous curve or line. For example, gives us a straight line extending infinitely in both directions.
Arrow diagrams
Another visual way to represent relations is with arrow diagrams. These show the mapping from domain values to range values using arrows.
For the relation , an arrow diagram would have the domain values on the left and range values on the right, with arrows connecting each ordered pair.
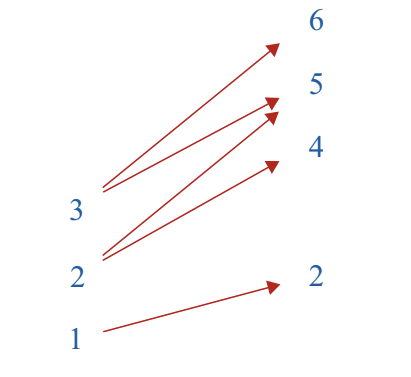
Arrow diagrams are particularly useful for understanding which domain values map to which range values, especially when one input relates to multiple outputs.
Finding domain and range from graphs
When we have a graph of a relation, we can determine its domain and range by examining the extent of the graph.
Domain: Look at the horizontal extent of the graph. What x-values are included? This gives the domain.
Range: Look at the vertical extent of the graph. What y-values are covered? This gives the range.
We typically express domain and range using interval notation:
- means all values from to , including both endpoints
- means all values from to , excluding both endpoints
- means including but excluding
- means all values greater than
- means all values less than or equal to
Worked example: Finding domain and range from graphs
Let's examine several relations and identify their domains and ranges.
Worked Example: Part a - Discrete Relation
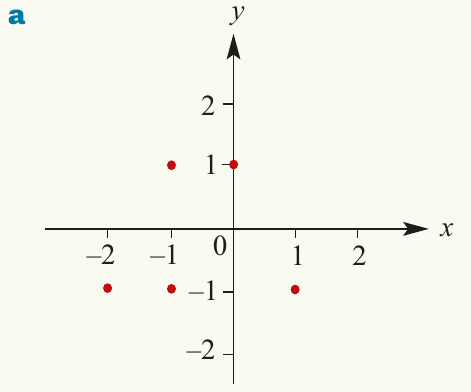
The discrete relation
Step 1: Identify the first coordinates Looking at the first coordinates: . The unique values are .
Domain = {-2, -1, 0, 1}
Step 2: Identify the second coordinates Looking at the second coordinates: . The unique values are .
Range = {-1, 1}
Worked Example: Part b - Circle Relation
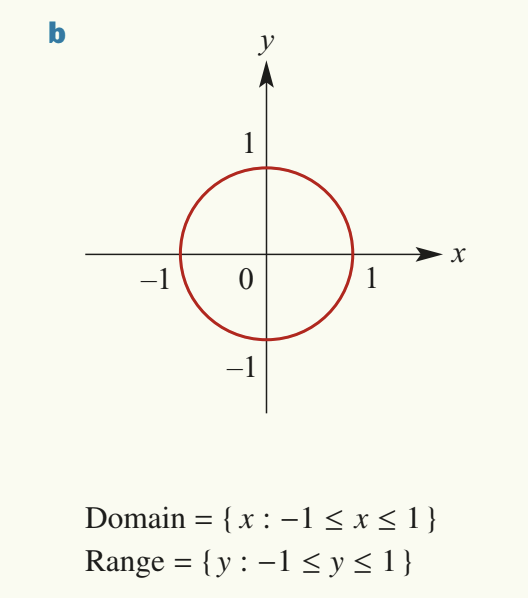
The relation
This is a circle with centre at the origin and radius 1.
The x-values extend from to , giving domain = {x : -1 ≤ x ≤ 1} or in interval notation.
The y-values also extend from to , giving range = {y : -1 ≤ y ≤ 1} or .
Worked Example: Part c - Linear Relation with Restriction
The relation
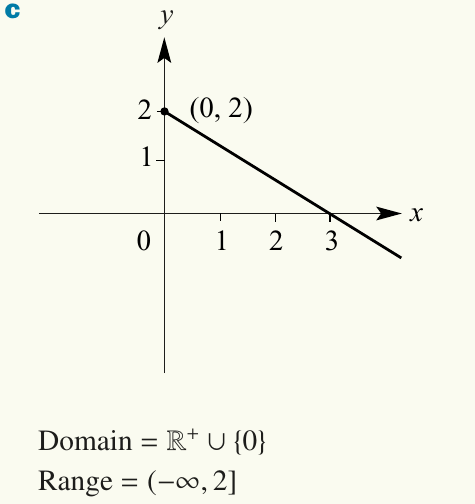
This is a straight line starting at the point when . The domain is restricted to non-negative x-values.
Domain = ℝ⁺ ∪ {0} (all non-negative real numbers)
The line has a negative slope, so as increases from , decreases from towards negative infinity.
Range = (-∞, 2]
Worked Example: Part d - Line Segment
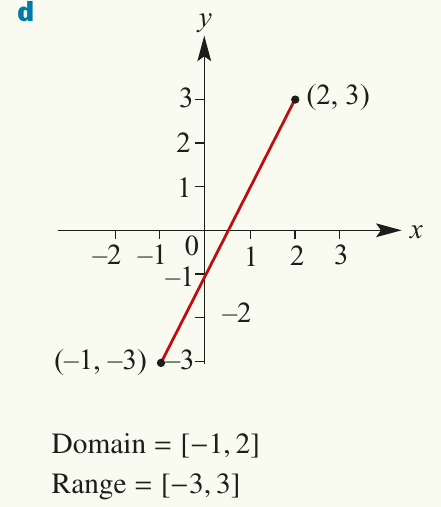
The relation
This is a line segment with restricted domain.
Step 1: Find the endpoints
When : , giving point
When : , giving point
Step 2: Determine domain and range
Domain = [-1, 2]
Range = [-3, 3]
Worked example: Quadratic relations
For quadratic relations, finding the range requires identifying the vertex (turning point).
Worked Example: Part a - Upward-Opening Parabola
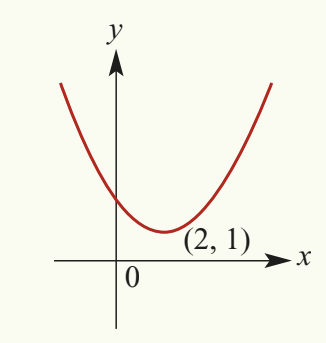
For with domain
Step 1: Complete the square
Step 2: Identify the vertex and range
The vertex is at . Since this is an upward-opening parabola, the minimum y-value is .
[Range = [1, ∞)]
Worked Example: Part b - Downward-Opening Parabola
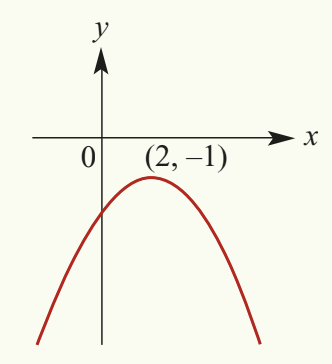
For with domain
Step 1: Complete the square
Step 2: Identify the vertex and range
The vertex is at . Since this is a downward-opening parabola, the maximum y-value is .
Range = (-∞, -1]
Worked example: Restricted domain quadratic
Worked Example: Quadratic with Restricted Domain
For the relation with
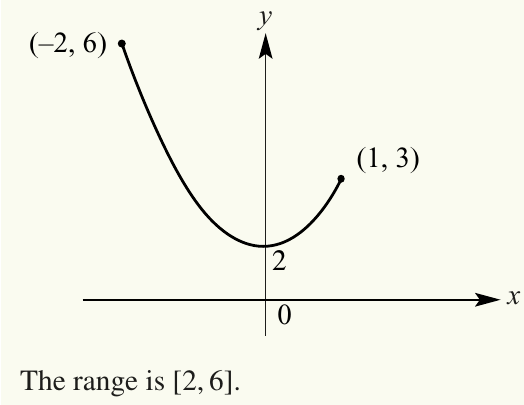
Step 1: Find the y-values at the endpoints
When : , giving point
When : , giving point
Step 2: Check for turning points within the domain
The vertex of is at , which lies within our domain.
Step 3: Determine the range
The minimum y-value is (at the vertex), and the maximum y-value is (at the endpoint ).
Range = [2, 6]
When finding the range of a relation with restricted domain, don't just look at the endpoints. Always check if there are any turning points (vertices, maximum or minimum points) within the domain, as these often determine the range.
Implied (maximal) domain
When we write a relation using a rule but don't specify a domain, we assume the domain is the largest set of x-values for which the rule makes mathematical sense. This is called the implied domain or maximal domain.
For example:
- For , the implied domain is (all real numbers) because we can square any real number
- For , the implied domain is because x-values outside this range would make , leaving no real y-values to satisfy the equation
Worked example: Implied domain
Worked Example: Part a - Circle with Implied Domain
For the relation
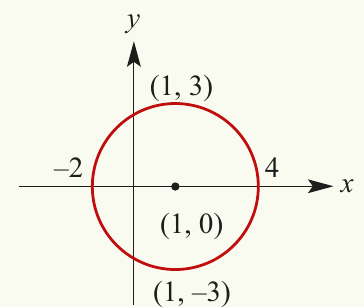
This is a circle with centre and radius .
Step 1: Find the horizontal extent
The x-values extend from to .
Implied domain = [-2, 4]
Step 2: Find the vertical extent
The y-values extend from to .
Range = [-3, 3]
Worked Example: Part b - Horizontal Parabola
For the relation
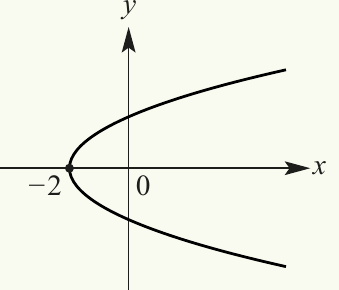
This is a parabola opening to the right (horizontal parabola) with vertex at .
Step 1: Determine the condition for real y-values
For real y-values to exist, we need , which means .
[Implied domain = [-2, ∞)]
Step 2: Find the range
The parabola extends infinitely upward and downward, so all y-values are possible.
Range = ℝ
Key Points to Remember:
- A relation is a set of ordered pairs
- The domain consists of all x-values (first coordinates) in the relation
- The range consists of all y-values (second coordinates) in the relation
- Relations can be represented as lists, graphs, arrow diagrams, or rules with specified domains
- To find domain and range from a graph, look at the horizontal extent (domain) and vertical extent (range)
- When no domain is specified, assume the implied domain - the largest set of x-values for which the rule makes sense
- For quadratic relations with restricted domains, always check for turning points within the domain to correctly determine the range