Average Rate of Change (VCE SSCE Mathematical Methods): Revision Notes
Average Rate of Change
Understanding rates of change
In real life, most objects don't travel at a steady speed. Think about driving a car through city traffic – your speedometer is constantly changing as you speed up, slow down, and stop at lights. This is very different from travelling at a constant speed on a highway.
Similarly, many functions have curved graphs rather than straight lines. This means the rate of change of the function varies at different points. For non-linear functions, we need a way to describe how quickly the function is changing over a particular interval.
The concept of average rate of change helps us understand changing quantities even when we can't determine the exact rate at every single moment. This is particularly useful in real-world situations where conditions are constantly varying.
Average speed
We can use distance-time graphs to understand the concept of average speed. Even when an object's speed is constantly changing, we can calculate an overall average speed for a journey.
Comparing constant and varying speeds
Consider two cars travelling away from point , where represents distance travelled (in metres) and represents time (in seconds).
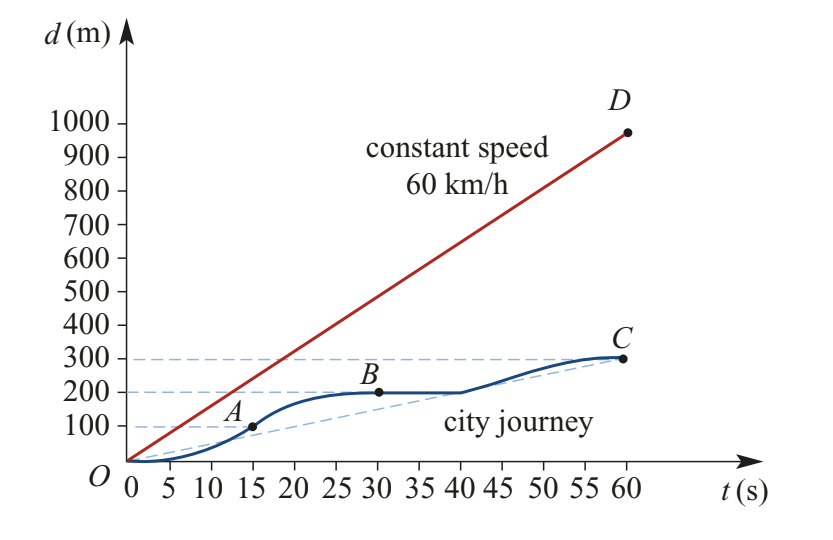
The straight red line shows a car travelling at a constant speed of km/h. The blue curved line shows a car travelling through the city with varying speeds. This car:
- Accelerates to reach km/h at point
- Slows down for traffic lights at point , where it stops for seconds
- Has another burst of speed
- Stops again at point
Although we don't know the exact speed of the city car at every moment (except when stationary), we can calculate its average speed over the full seconds.
Calculating average speed
The average speed is found using:
For the city journey, the car travelled metres in seconds:
Notice that this average speed equals the gradient of the line on the graph. This is a crucial connection – average speed can be found by calculating the gradient of the secant line connecting two points on a distance-time graph.
Average speed over any interval
You can calculate average speed for any time interval, not just the whole journey. For the interval from to , the average speed is given by the gradient of the line joining points and :
General formula
For an object moving between times and , if we know the positions at these times (points and on the graph), then:
Worked Example: Finding Average Speed from a Graph
The graph shows distance travelled (in metres) against time (in seconds) for a moving object. We need to find the average speed over the interval from to .
The graph shows point and point .
Step 1: Identify the formula
Step 2: Substitute the values
Step 3: Simplify
Answer: The average speed is 1.8 metres per second.
Average rate of change for a function
The concept of average speed can be extended to any function. Before we look at the general formula, we need to understand two important terms.
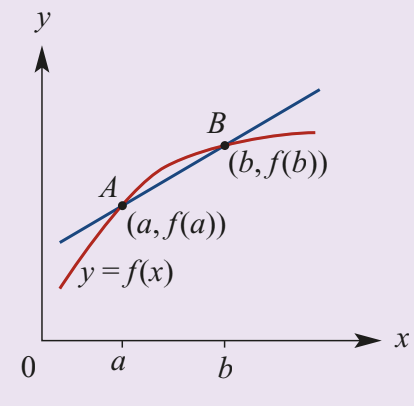
Secants and chords
Secant: A line that passes through two points on a curve is called a secant.
Chord: A line segment joining two points on a curve is called a chord.
Think of a secant as the full line that extends infinitely through two points, while a chord is just the segment between those two points. Both are useful for understanding average rate of change geometrically.
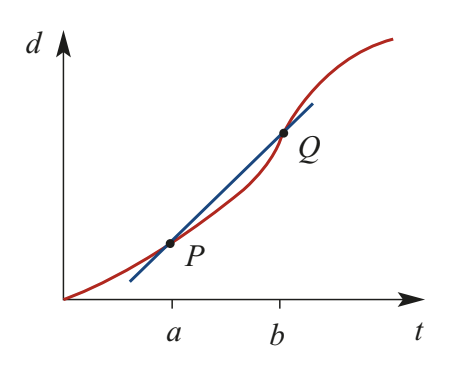
The general formula
For any function , we can find how quickly changes with respect to over an interval .
The average rate of change of with respect to over the interval is the gradient of the secant line passing through points and .
The Average Rate of Change Formula:
This represents:
- The change in values (numerator)
- Divided by the change in values (denominator)
This is essentially "change in output ÷ change in input"
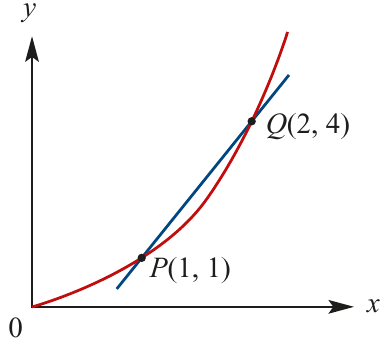
For the function shown in the diagram, we can find the average rate of change over the interval by calculating the gradient of secant :
So the average rate of change is .
Worked Example: Using a Function Rule
Find the average rate of change of the function as changes from to .
Step 1: Find and
Step 2: Apply the formula
Answer: The average rate of change is 4.
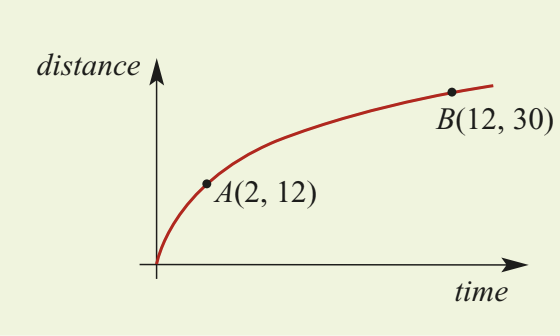
Worked Example: Using a Graph
Find the average rate of change of the function shown in the graph for the interval .
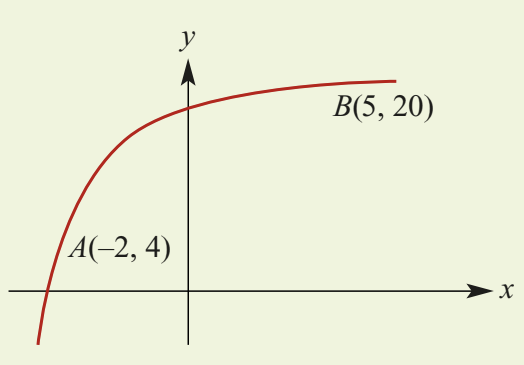
Step 1: Read the coordinates from the graph
From the graph, we can see points and .
Step 2: Apply the formula
Answer: The average rate of change is .
Worked Example: Real-world Application
The air temperature, °C, at a weather station on a particular evening is modelled by:
where is the time in hours after 6 p.m.
a) Find the temperature at 6 p.m.
At 6 p.m., :
Answer: The temperature at 6 p.m. is 20°C.
b) Find the temperature at midnight.
At midnight, :
(correct to two decimal places)
Answer: The temperature at midnight is 7.69°C.
c) Find the average rate of change of temperature from 6 p.m. until midnight.
Answer: The negative value tells us the temperature is decreasing at an average rate of 2.05°C per hour.
Key Points to Remember:
- Average speed equals total distance divided by total time:
- On a distance-time graph, average speed equals the gradient of the secant line connecting two points
- A secant is a line passing through two points on a curve; a chord is the line segment between those points
- For any function , the average rate of change over interval is:
- This formula represents change in output divided by change in input, which gives you the gradient of the secant line