Techniques Used to Measure Sleep (VCE SSCE Psychology): Revision Notes
Techniques Used to Measure Sleep
Introduction to sleep measurement
Sleep researchers and clinicians use various techniques to measure and observe sleep patterns. These methods fall into two main categories: objective measures based on physiological changes in the body, and subjective measures based on personal reports and observations.
These measurement techniques enable practitioners to detect and record several important features, including the onset of sleep, total sleep duration, sleep quality, night-time awakenings, body movements, and wake-up time. The data collected serves multiple purposes: diagnosing sleep disorders, monitoring how medications or lifestyle changes affect sleep, and even optimising athletic performance.
The combination of objective and subjective measurement techniques provides the most comprehensive understanding of sleep patterns. Objective measures capture biological changes, while subjective measures add personal context and experiences that cannot be detected by physiological monitoring alone.
The techniques commonly used include electroencephalography (EEG), electromyography (EMG), electro-oculography (EOG), sleep diaries, and video monitoring. These approaches are frequently combined in comprehensive sleep studies called polysomnography.
Physiological measurement techniques
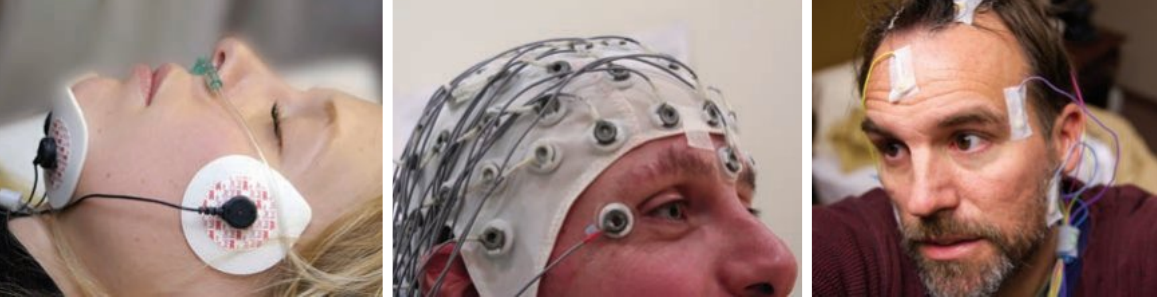
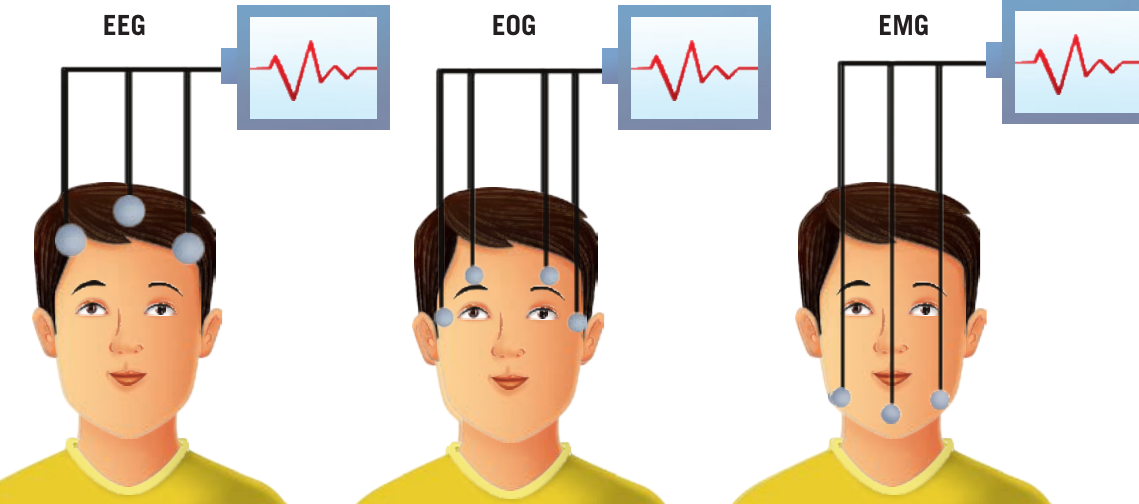
Physiological techniques measure objective biological changes that occur during sleep. The three primary methods - EEG, EMG, and EOG - all follow the same basic principle: detecting, amplifying, and recording electrical activity in different parts of the body.
The DARE Principle
All three physiological measurement techniques (EEG, EMG, and EOG) follow the same fundamental process:
- Detect electrical activity
- Amplify the signals
- Record the data
- Electrical activity measurement
The only difference between them is the location in the body where electrical activity is measured.
Electroencephalography (EEG)
Electroencephalography (EEG) is a technique that detects, amplifies and records the electrical activity of the brain.
How EEG works
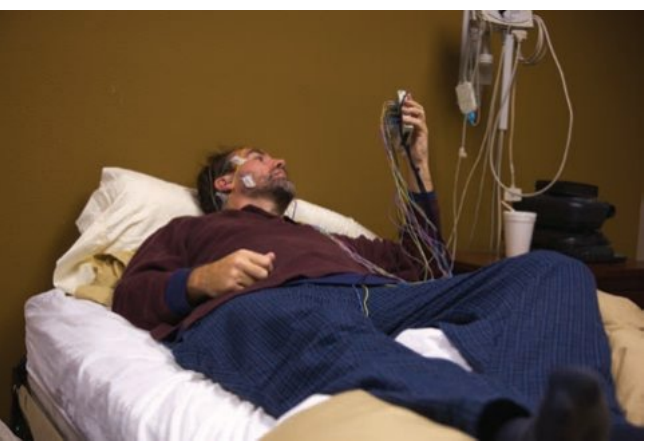
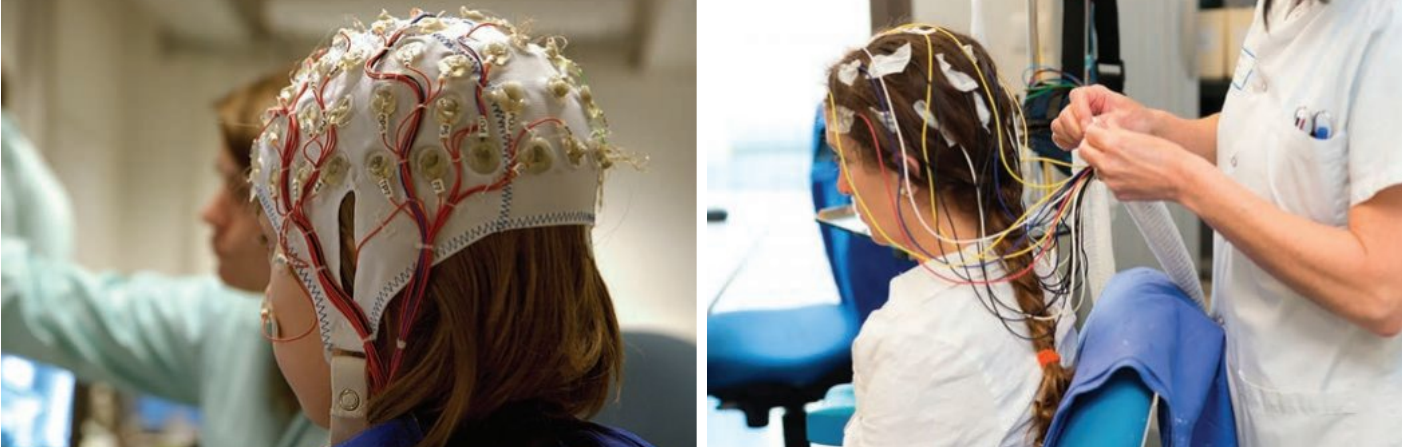
During an EEG recording, small sensors called electrodes are attached to the scalp, either individually or through a specially designed cap or headset. These electrodes detect synchronized electrical impulses produced by thousands of neurons communicating together just beneath the scalp at the cortex surface.
The electrical signal from a single neuron is too weak to detect through the scalp. Therefore, EEG recordings represent the combined activity of thousands of neurons firing together in the same brain region. Wires connected to the electrodes transmit these signals to an electroencephalograph instrument, which amplifies them to readable levels before sending the data to a computer for recording and analysis by specialists.
Brain wave characteristics
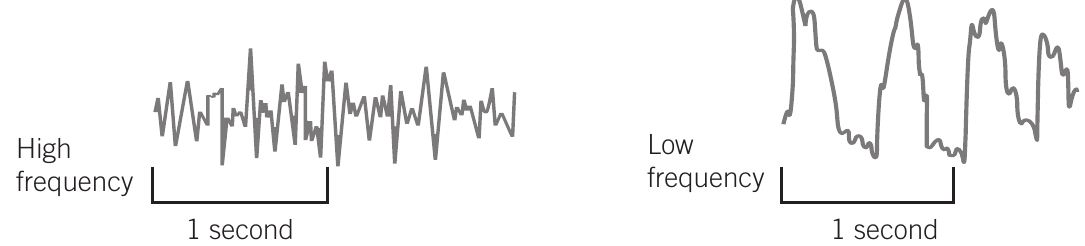
EEG recordings display brain activity as wave patterns with two key characteristics: frequency and amplitude.
Frequency indicates the speed of brain waves or how much neural activity occurs per second. Visually, frequency appears as how closely packed the waves are and how many times the wave pattern repeats within a one-second interval. Slower-frequency waves predominate when we are tired, relaxed, or asleep. Faster-frequency waves occur when we are awake and alert.
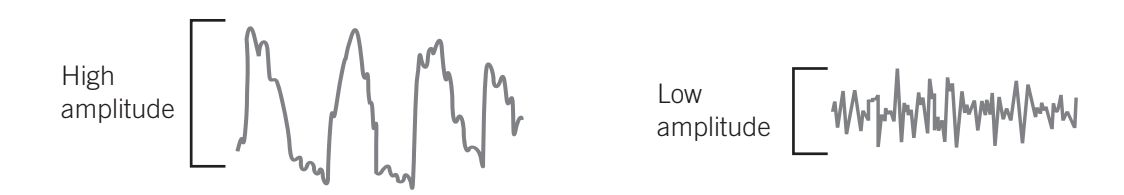
Amplitude represents the intensity or strength of brain waves, reflecting how many neurons fire synchronously. In recordings, amplitude is visible as the height of waves or the distance between peaks and troughs. Higher peaks and deeper troughs indicate multiple neurons working together on similar tasks, such as during sleep. Lower, flatter waves suggest neuron groups are engaged in different activities simultaneously, like when driving a car.
Understanding Frequency and Amplitude
Think of frequency and amplitude as two separate dimensions of brain activity:
- Frequency = How fast the brain is working (speed of neural activity)
- Amplitude = How synchronized the brain activity is (number of neurons firing together)
During sleep, the brain slows down (lower frequency) but becomes more synchronized (higher amplitude) as neurons work together on sleep-related processes.
Brain wave types
Four main brain wave types characterise different states of consciousness: beta, alpha, theta, and delta. Each has distinct frequency and amplitude patterns and occurs during specific wake or sleep states.
A general pattern exists across these brain wave types: as frequency decreases, amplitude increases. When a person progresses into deeper sleep stages, their brain wave activity slows down, shown by the transition through the four wave types. During REM sleep, brain activity increases again, producing faster wave patterns.
| Brain wave | Frequency and amplitude | State |
|---|---|---|
| Beta | Frequency: highest Amplitude: lowest | - Normal waking consciousness - Awake, alert and focused - High environmental stimulation - Brain processing multiple tasks simultaneously |
| Alpha | Frequency: high Amplitude: low | - Lower alertness - Awake but relaxed - Quiet and calm - Drowsy - Eyes closed - Low environmental stimulation |
| Theta | Frequency: low Amplitude: high | - Low alertness - Light sleep - Senses withdrawn from external environment - Deep meditation |
| Delta | Frequency: lowest Amplitude: highest | - Lowest alertness - Deep N3 sleep - Dreamless sleep |
The Inverse Relationship Between Frequency and Amplitude
As you transition from wakefulness into deeper sleep, brain waves follow a predictable pattern:
- Frequency decreases (waves slow down: Beta → Alpha → Theta → Delta)
- Amplitude increases (waves become taller and more synchronized)
Remember: "Down to sleep = Frequency Drops, Amplitude Ascends"
Applications in sleep measurement
Different sleep types and stages produce distinct brain wave patterns. EEG recordings help identify particular sleep stages and detect abnormal brain activity that deviates from expected patterns. For instance, unusual brain activity during sleep may signal a sleep disorder, whilst specific patterns can pinpoint the exact moment a person falls asleep.
Electromyography (EMG)
Electromyography (EMG) is a technique that detects, amplifies and records the electrical activity of the skeletal muscles.
How EMG works
During an electromyogram in a sleep study, electrodes are attached to the skin surface, typically positioned around the jaw and sometimes on the legs or other body parts. EMG produces wave pattern outputs similar to EEG recordings; however, these waves are not referred to using the same names as brain waves.
Applications in sleep measurement
EMG measurements of muscle tension indicate which sleep stage and type a person is experiencing. Generally, greater muscle tension corresponds to higher alertness levels. As someone drifts into deeper sleep, muscle movement progressively decreases. During REM sleep, no muscle movement is detected at all.
Muscle activity measured by EMG follows a clear pattern across sleep stages:
- Wakefulness = High muscle tension and activity
- Light sleep = Reduced muscle tension
- Deep sleep = Further decrease in muscle activity
- REM sleep = Complete absence of muscle movement (sleep paralysis)
EMG can also identify abnormal movements during sleep, such as tossing and turning, teeth grinding (sleep bruxism), or leg movements. These patterns may indicate sleep disorders like periodic limb movement disorder.
Electro-oculography (EOG)
Electro-oculography (EOG) is a technique that detects, amplifies and records the electrical activity of the muscles controlling the eyes.
How EOG works
During an electro-oculogram in a sleep study, electrodes are attached to the skin surface around the sides of each eye. The output appears as recorded wave patterns similar to EEG readings.
Applications in sleep measurement
EOG recordings help determine sleep onset and identify when different sleep stages and types occur. As you drift into deeper sleep, eye movements decrease and slow down. Conversely, during REM sleep, eye movement activity increases markedly.
Eye movements tracked by EOG provide clear indicators of sleep stages:
- Wakefulness = Frequent voluntary eye movements
- Drowsiness = Slow, rolling eye movements
- Light to deep sleep = Minimal or no eye movement
- REM sleep = Rapid, darting eye movements (the defining characteristic of REM sleep)
Polysomnography
Polysomnography is a multi-parameter sleep study used as a diagnostic tool in sleep medicine.
This comprehensive approach combines EEG, EMG, and EOG measurements, often alongside other monitoring techniques like video recording. By integrating multiple data sources, polysomnography provides a complete picture of physiological activity during sleep.
Important note on describing technique outputs
Critical Distinction: Describing EEG vs EMG/EOG Outputs
When describing recordings in psychology, only EEG outputs are characterised using the specific brain wave types (beta, alpha, theta, delta).
For EEG: "During a state of high awareness and focused attention, an EEG would detect, amplify and record electrical activity of the brain, showing beta waves with high frequency and low amplitude."
For EMG and EOG: Describe the output simply as either "high activity" or "low activity" without reference to specific wave types.
For EMG: "During a state of high awareness and focused attention, an EMG would detect, amplify and record high electrical activity of the muscles."
The DARE acronym helps remember the four key words needed in all definitions: Detect, Amplify, Record, Electrical.
Subjective measurement techniques
Whilst physiological techniques provide objective biological data, subjective techniques capture personal experiences and observations of sleep.
Sleep diaries
Sleep diaries are subjective self-report tools used by a person to track their own sleep and wake patterns.
Purpose and function
Before diagnosing a sleep disorder, people reporting sleep difficulties typically complete an assessment of their typical sleep patterns, including the nature of their sleep, severity of symptoms, and potential causes. Sleep diaries help identify patterns or habits that may contribute to sleep problems and provide sleep specialists with personal, subjective accounts of sleep quantity and quality.
Content and structure
Many formats and types of sleep diaries exist, but most typically include spaces to record:
- Time of sleep onset
- Waking time
- How the person felt upon waking
- Any sleep disturbances (periods of waking, unusual behaviours like sleepwalking or night terrors)
- Factors potentially affecting sleep (caffeine intake throughout the day, naps taken, exercise completed)
- Pre-bedtime consumption (alcohol, heavy meals, caffeine)
- Bedtime routine activities
Individuals usually maintain their sleep diary for several weeks to establish patterns.
Sleep diaries are typically maintained over an extended period (often 2-4 weeks) because sleep patterns can vary significantly from night to night. This extended recording period helps identify consistent patterns versus occasional occurrences, providing a more accurate picture of typical sleep behaviors.
Combining subjective and objective data
Disturbed sleep may either cause or result from mental health disorders. Once subjective data has been collected through a sleep diary, sleep specialists can interpret it and determine whether further assessments are needed. Combining sleep diary information with objective measures such as EEG, EOG, or EMG data enables more accurate assessments than either approach alone.
Neither subjective nor objective measures alone provide a complete picture of sleep. Sleep diaries capture personal experiences, feelings, and contextual factors that physiological devices cannot detect, while EEG, EMG, and EOG provide objective biological data that eliminates self-report bias. The combination of both approaches offers the most comprehensive and accurate sleep assessment.
Video monitoring
Video monitoring is a sleep study tool used to collect qualitative visual and audio information about a person's sleep.
Purpose and applications
During sleep studies, video monitoring is used alongside EEG, EOG, and EMG recordings. It validates the data collected by these physiological devices by showing exactly what activity occurs whilst someone sleeps. This includes sleeping positions, specific movements, laboured breathing, sleep talking, or teeth grinding.
Video monitoring proves particularly valuable when working with children who have sleep problems. Children may struggle to verbalise their experiences or may be too young to complete sleep diaries accurately.
Video Monitoring with Special Populations
Video monitoring is especially useful for:
- Young children who cannot complete sleep diaries
- Individuals with communication difficulties
- Cases where specific sleep behaviors need visual confirmation (e.g., sleepwalking, sleep terrors)
- Diagnosing sleep disorders that involve physical movements or vocalizations
The visual and audio data helps validate what physiological measures indicate and provides context that numbers alone cannot capture.
The additional information provided by video monitoring, combined with physiological measures and sleep diaries, assists in diagnosing sleep disorders more accurately.
Key Points to Remember:
-
All three physiological techniques follow the DARE principle: they Detect, Amplify, Record, and measure Electrical activity - but in different body parts (EEG = brain, EMG = skeletal muscles, EOG = eye muscles).
-
Brain waves show an inverse relationship: as you transition into deeper sleep, frequency decreases whilst amplitude increases, progressing through beta → alpha → theta → delta waves.
-
Each measurement technique serves a specific purpose: EEG identifies sleep stages through brain waves, EMG tracks muscle tension changes, EOG monitors eye movements, sleep diaries capture subjective experience, and video monitoring validates physiological data.
-
Combining techniques provides the most complete picture: polysomnography integrates multiple measurement approaches to give a comprehensive understanding of sleep patterns and help diagnose sleep disorders accurately.
-
Objective and subjective measures complement each other: physiological data (EEG, EMG, EOG) provides measurable biological information, whilst sleep diaries and video monitoring add personal context and observable behaviors that numbers alone cannot capture.
-
Only EEG outputs use specific wave names: When describing technique outputs, only EEG recordings are characterised using beta, alpha, theta, or delta waves. EMG and EOG outputs are simply described as "high activity" or "low activity."