Maxwell–Boltzmann Distributions (AQA A-Level Chemistry): Revision Notes
📚 Revision Notes
1.7.3 Maxwell–Boltzmann Distributions
What is the Maxwell-Boltzmann Distribution?
The Maxwell-Boltzmann distribution describes the distribution of molecular energies in a gas at a given temperature. It provides a graphical representation of how many gas molecules have various amounts of kinetic energy.
- The distribution is based on the fact that at any temperature, gas molecules will have a range of energies, from very low to very high.
- A Maxwell-Boltzmann curve shows this energy distribution and helps explain how temperature and other factors affect reaction rates.
Key Features of the Maxwell-Boltzmann Distribution
- The graph is asymptotic, meaning the curve approaches the horizontal axis but never touches it.
- The curve shows a peak where most molecules have a moderate amount of energy. This is the most probable energy.
- There are fewer molecules with very low or very high energies, as shown by the tails of the curve.
- The area under the curve represents the total number of molecules.
Maxwell-Boltzmann Distribution at Different Temperatures
Temperature has a significant effect on the distribution of molecular energies:
At Higher Temperatures
- The curve shifts to the right and flattens. This is because the average kinetic energy of the molecules increases.
- More molecules have energies above the activation energy, which leads to a higher rate of successful collisions and thus a faster reaction rate.
- The peak of the curve is lower and occurs at a higher energy.
At Lower Temperatures
- The curve shifts to the left and becomes taller. This means more molecules have lower kinetic energy.
- Fewer molecules have enough energy to surpass the activation energy, so the reaction rate is slower.
- The peak of the curve is higher and occurs at a lower energy.
Interpreting the Maxwell-Boltzmann Distribution
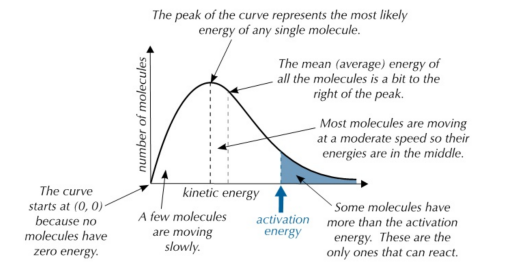
- Most probable energy: The peak of the curve represents the energy that the largest number of molecules possess.
- Average energy: Located to the right of the peak, the average energy is higher than the most probable energy because the distribution is skewed.
- Activation energy (Ea): The energy threshold that molecules must exceed for a reaction to occur. Only the molecules with energy greater than (Ea) will successfully react.
- As the temperature increases, more molecules will have energies exceeding the activation energy, increasing the rate of reaction.
The Effect of Catalysts on the Maxwell-Boltzmann Distribution
A catalyst does not change the shape of the Maxwell-Boltzmann distribution curve but it lowers the activation energy (Ea).
- This means that a greater proportion of molecules now have enough energy to surpass the activation energy, even without increasing the temperature.
- As a result, the rate of reaction increases because more molecules can successfully collide and react.
infoNote
Summary
- The Maxwell-Boltzmann distribution is a plot that shows the spread of molecular energies in a gas at a given temperature.
- The shape of the curve changes with temperature: higher temperatures shift the curve to the right and flatten it, while lower temperatures shift it to the left and make it taller.
- Catalysts lower the activation energy, allowing more molecules to have sufficient energy to react.
- By interpreting these curves, we can predict how temperature and the presence of a catalyst affect the rate of chemical reactions.