Efficiency, Resource Allocation, and Consumer & Producer Surplus (AQA A-Level Economics): Revision Notes
Efficiency, Resource Allocation, and Consumer & Producer Surplus
Understanding different types of efficiency
When economists analyse how well markets work, they examine different types of efficiency. These can be grouped into two main categories based on when they occur.
Static efficiency refers to how efficiently resources are being used at a specific point in time. This includes both productive efficiency (minimising average costs of production) and allocative efficiency (producing where price equals marginal cost, or ). You can think of static efficiency as taking a snapshot of the economy and measuring how well it's performing right now.
Dynamic efficiency involves improvements in efficiency that happen over time. These improvements result from technical progress and innovation. Dynamic efficiency is particularly important because it drives long-term economic growth. Firms can achieve dynamic efficiency by investing in research and development (R&D) and creating new, better products or production methods.
Interestingly, monopoly profits can contribute to dynamic efficiency. Although monopolies are not allocatively efficient in the short run, they may use their abnormal profits to fund innovation and technological advancement. This creates a trade-off between short-run static efficiency and long-run dynamic efficiency.
Resource allocation and efficiency
Dynamic efficiency leads to important changes in how resources are allocated across the economy. When firms become more efficient over time, resources naturally shift away from high-cost industries towards lower-cost industries. Additionally, resources move into better ways of making existing products and into the development of completely new products. This reallocation improves overall economic welfare.
Consumer surplus
Consumer surplus is a crucial concept for understanding economic welfare and market outcomes. It measures the economic benefit that consumers receive from participating in a market.
Consumer surplus is the difference between the maximum price a consumer is prepared to pay for a good and the actual price they pay. In other words, it's the extra satisfaction or utility consumers enjoy because they pay less than they would have been willing to pay.
Understanding Consumer Surplus in Practice
If you're willing to pay up to $50 for a concert ticket but you actually buy it for $30, your consumer surplus is $20. This represents genuine economic welfare that you've gained from the transaction.
Measuring consumer surplus
We can measure consumer surplus using supply and demand diagrams. In a competitive market, total consumer surplus is represented by the triangular area below the demand curve and above the market price.
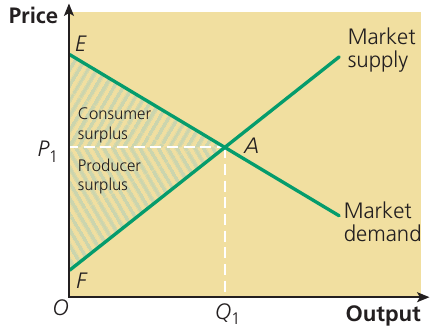
As shown in the diagram, consumer surplus is the shaded area above the equilibrium price and below the demand curve. This triangle extends from the vertical price axis to the equilibrium point A. The size of this area represents the total welfare enjoyed by all consumers in the market.
Consumer surplus increases when market prices fall. Lower prices mean consumers pay less while still valuing the good at the same level, so they gain extra welfare. Conversely, higher prices reduce consumer surplus because consumers must pay more for the same goods.
Producer surplus
Producer surplus is the mirror image of consumer surplus, but it measures the welfare of producers rather than consumers.
Producer surplus is the difference between the minimum price a firm would be prepared to charge for a good and the actual price charged. It represents the economic welfare that producers gain from selling at market prices.
Producer Surplus in Agriculture
If a farmer would be willing to sell wheat for at least $100 per tonne (to cover costs) but actually receives the market price of $150 per tonne, the producer surplus is $50 per tonne.
Measuring producer surplus
On a supply and demand diagram, producer surplus is shown by the triangular area above the supply curve and below the market price. Looking at the previous diagram, producer surplus is the shaded area below the equilibrium price and above the supply curve, extending from the vertical price axis to point A.
Understanding both consumer and producer surplus helps us analyse how economic welfare is affected by changes in market conditions, such as price changes, taxes, or shifts in market structure.
Deadweight loss and market failure
When we compare different market structures, we can see how efficiency and welfare change. Perfect competition achieves both productive and allocative efficiency in the long run, maximising total economic welfare. However, monopoly creates inefficiency and welfare loss.
Deadweight loss is the net loss of economic welfare that occurs when the maximum achievable level of total welfare fails to be reached. It represents resources that are misallocated or underutilised, leading to a reduction in overall economic wellbeing.
How monopoly creates deadweight loss
When a perfectly competitive market transforms into a monopoly, significant changes occur in the distribution of surplus and total welfare. The monopolist restricts output to maximise profit, which causes both consumer surplus and producer surplus to change.
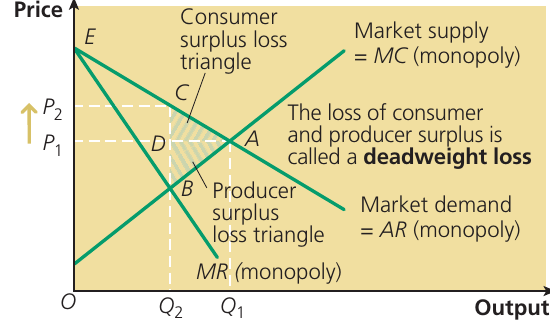
The diagram shows what happens when monopoly replaces perfect competition. In perfect competition, output would be at price (where supply equals demand, or where for the competitive industry). However, the monopolist produces where marginal revenue equals marginal cost, giving output at price .
This restriction of output creates several effects:
-
Loss of consumer surplus: Consumers lose welfare in two ways. First, some consumer surplus transfers to the monopolist as they charge higher prices. Second, some consumer surplus is lost entirely, represented by the upper triangle in the diagram.
-
Change in producer surplus: The monopolist gains some consumer surplus (through higher prices), increasing producer surplus. However, the monopolist also loses some producer surplus by restricting output, shown by the lower triangle.
-
Net welfare loss: The two triangular areas together represent the deadweight loss. This is welfare that existed under perfect competition but disappears under monopoly. No one receives this welfare – it's simply lost to society.
The deadweight loss demonstrates market failure. The monopoly's restriction of output means that units of the good which consumers value more than the cost of production are not being produced. This represents inefficient resource allocation.
Price discrimination and consumer surplus
Price discrimination occurs when firms charge different prices to different customers for essentially the same good or service. This practice has important implications for consumer and producer surplus.
Firms undertaking price discrimination generally benefit from the practice. However, the effects on consumers are more complex. Price discrimination typically reduces consumer surplus because it transfers welfare away from consumers towards producers.
Impact of price discrimination on surplus
When firms engage in price discrimination, they capture surplus that would otherwise belong to consumers. This happens because price discrimination allows firms to charge each customer closer to their maximum willingness to pay, rather than charging everyone a single market price.
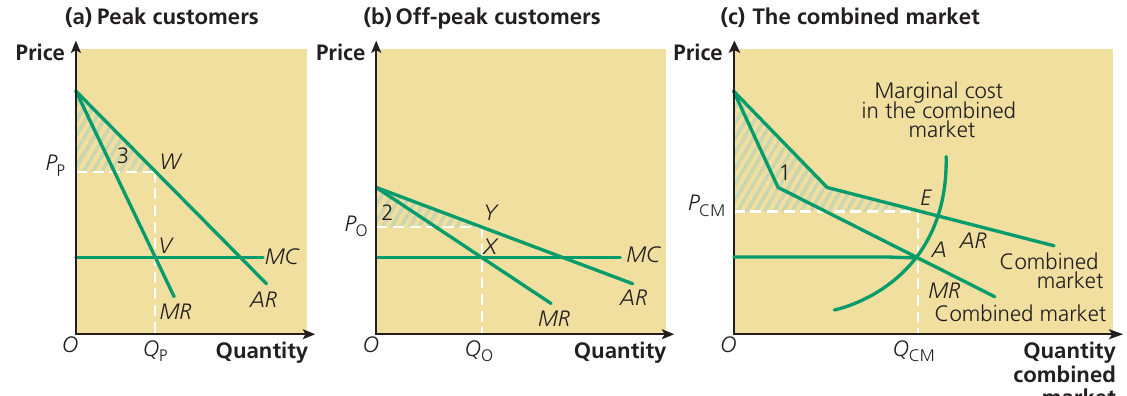
The diagram illustrates price discrimination between peak and off-peak customers. By charging different prices to these market segments ( for peak customers and for off-peak customers), the firm increases its profit. This profit increase comes from converting consumer surplus into producer surplus.
From the consumer perspective, this represents a disadvantage. Consumers end up worse off because they lose welfare through paying higher prices than they would under a single-price system. The firm benefits by transferring this consumer surplus to itself as additional profit.
First-degree price discrimination: the limiting case
The most extreme form of price discrimination is first-degree (or perfect) price discrimination. In this scenario, the firm charges each individual customer exactly the maximum price they're prepared to pay. This is also called the "limiting case" of price discrimination.
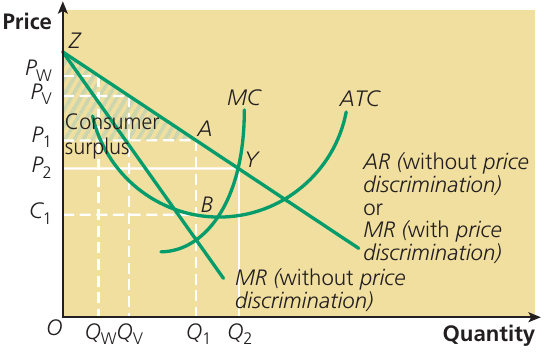
Under perfect price discrimination, the firm's marginal revenue curve coincides with the demand (or average revenue) curve. This is because charging each customer their maximum willingness to pay means that each additional unit sold generates revenue equal to the price on the demand curve, not below it as in standard monopoly.
With perfect price discrimination, the firm produces output where , which is the same output level as perfect competition (because MR now equals AR). However, there's a crucial difference: all consumer surplus is transferred to the producer. Consumers receive no surplus at all – they pay exactly what they're willing to pay for each unit.
This complete transfer of consumer surplus raises interesting questions:
- Efficiency: Perfect price discrimination achieves allocative efficiency because output equals the competitive level (where for the marginal consumer)
- Equity: The distribution of welfare is extremely unequal, with producers capturing all the surplus
- Practicality: Perfect price discrimination is rarely achievable in reality because firms cannot perfectly identify each customer's willingness to pay
Benefits of price discrimination
Despite reducing consumer surplus, price discrimination can have some positive effects. It may enable firms to supply goods and services to poorer customers who otherwise couldn't afford them.
Price Discrimination Enabling Service Provision
A doctor in an isolated village might need to charge higher prices to wealthy patients to make enough income to continue serving the community. Without price discrimination, the doctor might leave, and poorer patients would lose access to medical care entirely.
Similarly, railways and other services might not be economically viable without price discrimination. By charging business travellers higher peak prices, companies can subsidise off-peak services that benefit leisure travellers and lower-income customers.
Remember!
Key Points to Remember:
-
Static efficiency measures how well resources are being used at a particular point in time, while dynamic efficiency refers to improvements in efficiency over time through innovation
-
Consumer surplus is the difference between what consumers are willing to pay and what they actually pay, representing consumer welfare
-
Producer surplus is the difference between the minimum price producers would accept and the actual price received, representing producer welfare
-
Deadweight loss occurs when monopoly restricts output below the competitive level, creating a net loss of welfare to society – this represents market failure
-
Price discrimination transfers consumer surplus to producers, reducing consumer welfare but potentially enabling service provision to markets that wouldn't otherwise be profitable