Determinants of Demand (AQA A-Level Economics): Revision Notes
Determinants of Demand
Introduction to demand and markets
When economists talk about demand, they're referring to something quite specific. Understanding demand is essential for analyzing how competitive markets work and how prices are determined.
A market is a voluntary meeting of buyers and sellers where exchange takes place. Modern markets don't need to exist in a specific physical location. With the growth of e-commerce, many markets operate entirely online, allowing buyers and sellers to interact 24/7 from anywhere in the world. Whether it's a traditional high street shop or an online platform, what matters is that willing buyers and sellers come together to trade.
Within markets, both demand and supply interact to determine prices and quantities. Demand refers to the quantity of a good or service that consumers are willing and able to buy at given prices in a given period of time. Similarly, supply is the quantity that producers are willing and able to sell at given prices in a given period of time.
Notice that both definitions emphasize "willing and able" - this is crucial for understanding what economists mean by demand. Both conditions must be met for true economic demand to exist.
What is effective demand?
Not all desire for goods and services counts as economic demand. You might want to own a luxury sports car or take an expensive holiday, but if you can't afford it, this doesn't constitute demand in the economic sense. Effective demand is the desire for a good or service backed by an ability to pay. Only when consumers both want something and have the financial means to purchase it does their desire become part of market demand.
This distinction is important because it explains why markets respond to those with purchasing power. A person earning 1 million, but this dream doesn't represent effective demand. Their desires don't influence the market because they lack the ability to pay.
This highlights why demand is fundamentally linked to both consumer preferences and income levels.
Understanding the demand curve
A demand curve provides a visual representation of the relationship between a product's price and the quantity consumers wish to purchase. This relationship is typically inverse: as price falls, quantity demanded increases, and as price rises, quantity demanded decreases. This is known as the law of demand and reflects basic consumer behaviour - people generally buy more when things are cheaper and less when they're expensive.
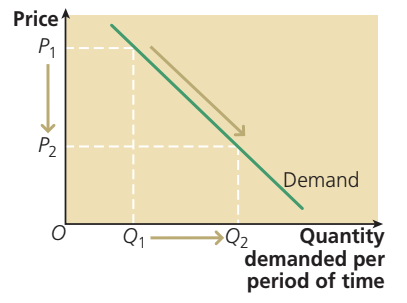
In a demand curve diagram, price is shown on the vertical axis and quantity demanded per period of time is on the horizontal axis. The phrase "per period of time" is important because demand must always be measured over a specific timeframe. Weekly demand differs from monthly or annual demand, so economists must specify the time period they're analyzing.
When we draw a demand curve, we use the ceteris paribus assumption, meaning "other things being equal". We assume that all factors influencing demand apart from price remain unchanged. This allows us to isolate and examine the relationship between price and quantity demanded without other variables complicating the picture.
Market demand versus individual demand
It's important to distinguish between individual demand and market demand. Individual demand represents the quantity of a good that one particular consumer wishes to buy at different prices. Market demand, by contrast, is the total quantity that all consumers in a market want to buy at different prices. Market demand is simply the sum of all individual demands in that market.
Understanding Market Demand:
If ten consumers each want to buy two chocolate bars at $1 each, the market demand at that price is twenty chocolate bars.
This shows how markets aggregate individual preferences into overall market behavior.
Movements along versus shifts of the demand curve
This is one of the most important concepts in demand analysis, and students often confuse the two. Understanding the difference between a movement along a demand curve and a shift of the demand curve is crucial for exam success.
A movement along a demand curve occurs only when the good's own price changes. If the price of chocolate bars increases, we move up along the demand curve, and quantity demanded falls. If the price decreases, we move down the curve, and quantity demanded rises. The demand curve itself doesn't move - we're simply traveling to a different point on the existing curve. This is sometimes called an extension of demand (when moving down) or a contraction of demand (when moving up).
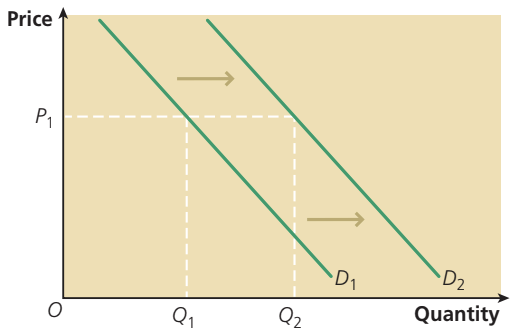
By contrast, a shift of the demand curve occurs when a factor other than the good's own price changes. When this happens, the entire demand curve moves to a new position. An increase in demand is shown by a rightward shift, meaning more is demanded at every price level. A decrease in demand is shown by a leftward shift, meaning less is demanded at every price level.
Exam tip: In your exam, clearly state whether you're describing a movement along or a shift of the curve. Confusing these concepts is a common mistake that costs marks.
Remember this key rule:
- Price changes cause movements along the curve
- Other factors cause shifts of the entire curve
The conditions of demand
The factors that determine the position of the demand curve (other than the good's own price) are called the conditions of demand or determinants of demand. When any of these conditions change, the demand curve shifts to a new position. The main conditions of demand include:
Prices of substitute goods
Substitute goods are alternative products that could be used for the same purpose. For example, butter and margarine are substitutes, as are tea and coffee, or Coca-Cola and Pepsi. When two goods are substitutes, an increase in the price of one leads to increased demand for the other.
Imagine the price of tea rises significantly. Many consumers will switch to coffee instead, causing the demand curve for coffee to shift rightward. The opposite occurs if tea's price falls - demand for coffee would shift leftward as people switch back to tea. This relationship exists because substitutes compete for the same consumer spending.
Prices of complementary goods
Complementary goods are products that are consumed together - they experience joint demand. Classic examples include cars and petrol, printers and ink cartridges, or bread and butter. When two goods are complements, a fall in the price of one increases demand for both products.
Complementary Goods in Action:
Consider cars and petrol. If car prices drop significantly, more people will buy cars. This increases demand for petrol because car ownership and petrol consumption go together.
The demand curve for petrol shifts rightward even though petrol's own price hasn't changed. Conversely, if car prices rise sharply, fewer people buy cars, and demand for petrol decreases.
Personal disposable income
Changes in consumer income significantly affect demand for most goods. However, the direction of the effect depends on whether we're dealing with normal goods or inferior goods (explained in detail below). Generally, when people's incomes rise, they can afford to buy more, so demand for most products increases. When incomes fall, demand typically decreases.
What matters is disposable income - the income people have left after paying taxes and receiving any benefits. This is the money actually available for spending on goods and services.
Tastes and preferences
Consumer preferences play a major role in determining demand. These preferences can change for various reasons, including fashion trends, health concerns, or cultural shifts. When a product becomes more fashionable or desirable, its demand curve shifts rightward. When it falls out of favor, demand shifts leftward.
Advertising campaigns can significantly influence tastes and preferences. A successful marketing campaign that makes people think more favorably about a product will shift its demand curve rightward, increasing demand at all price levels. This is why companies invest heavily in advertising - they're attempting to shift the demand curve for their products.
Population size
The total size of the population influences overall market size. A larger population generally means more potential consumers, so demand for most goods increases. This is straightforward: if a town's population doubles, we'd expect demand for basics like food, housing, and transport to increase substantially.
Population changes can occur through birth rates, death rates, or migration patterns. They can also affect demand for specific products - for instance, an aging population increases demand for healthcare services and reduces demand for children's toys.
Normal goods and inferior goods
The relationship between income and demand isn't always straightforward. Economists classify goods based on how demand responds to income changes:
A normal good is one for which demand increases as income rises and decreases as income falls. Most goods fall into this category. When people earn more money, they typically buy more clothes, electronics, holidays, and restaurant meals. These are all normal goods.
An inferior good is one for which demand decreases as income rises and increases as income falls. The classic example is bus travel. As people's incomes increase, many switch from buses to private cars, reducing their demand for bus services. The bus service hasn't changed, but consumers' higher income allows them to choose a preferred alternative.

How Goods Can Change Classification:
Food choices provide an interesting example. For many children, sweets and junk food are normal goods - if they have more pocket money, they buy more sweets.
However, as people grow older and wealthier, their preferences often change. Adults with higher incomes might reduce consumption of cheap junk food in favor of healthier, higher-quality alternatives. In this case, junk food has become an inferior good for them.
Whether a good is normal or inferior can depend on the individual consumer, their income level, and their personal tastes. Age also plays a role - what's a normal good for a child might become inferior in adulthood.
When income increases:
- If a good is normal, its demand curve shifts rightward
- If the good is inferior, its demand curve shifts leftward
This shows how the same change (rising income) can have opposite effects depending on the type of good.
Applying your understanding
To master this topic, practice identifying whether scenarios involve movements along or shifts of demand curves. Ask yourself: "Has the good's own price changed, or has something else changed?"
Also practice determining the direction of shifts. If household income increases by 3% and demand for summer holidays increases by 5%, this represents a rightward shift of the demand curve (an increase in demand), not a movement along it. The price of holidays hasn't necessarily changed - people simply want more holidays at every price level because they can now afford them.
Key Points to Remember:
-
Effective demand requires both willingness and ability to pay - mere desire isn't enough
-
A movement along a demand curve is caused only by a change in the good's own price
-
A shift of the demand curve is caused by changes in the conditions of demand (factors other than price)
-
The main conditions of demand are:
- Prices of substitutes
- Prices of complements
- Income
- Tastes and preferences
- Population
-
Substitute goods compete with each other - a price rise in one increases demand for the other
-
Complementary goods are consumed together - a price fall in one increases demand for the other
-
Normal goods see demand rise with income; inferior goods see demand fall with income