Measures of Dispersion (AQA A-Level Geography): Revision Notes
Measures of Dispersion
Measures of dispersion help us understand how spread out or scattered data values are within a dataset. Whilst measures of central tendency (like mean and median) tell us about the middle or typical value, measures of dispersion reveal how much variation exists around that central point. There are three main measures you need to know: range, inter-quartile range, and standard deviation.
Understanding dispersion is just as important as knowing the average value. Two datasets can have the same mean but completely different spreads, leading to very different interpretations of the data.
Range
Range provides the simplest way to measure how spread out your data is. It shows the total span of values in your dataset.
To calculate range, you subtract the lowest value from the highest value in your data:
Range = Highest value - Lowest value
Worked Example: Corrie Orientation Data
Let's look at an example using corrie (glacial valley) orientation measurements:
- For corries in the Glyders: Range =
- For corries on Arran: Range =
The Arran corries show a much larger range () compared to the Glyders (), indicating greater variation in their orientations.
Limitations of range
Whilst range is quick to calculate, it only uses two values from your entire dataset (the maximum and minimum). This means it can be heavily influenced by extreme values or outliers, which may not represent the overall spread of your data accurately.
Inter-quartile range
The inter-quartile range (IQR) offers a more reliable measure of spread because it focuses on the middle 50% of your data, making it less affected by extreme values.
How to calculate IQR
To find the IQR, you need to organize your data from smallest to largest, then divide it into four equal groups called quartiles:
Upper quartile (UQ): This is the value located at the position when data is arranged from highest to lowest. It marks the boundary between the first and second quarters of your data.
Lower quartile (LQ): This is the value located at the position. It marks the boundary between the third and fourth quarters of your data.
Calculating IQR:
The IQR tells us how spread out the middle 50% of values are around the median. A larger IQR indicates greater spread, whilst a smaller IQR suggests the data is more clustered together.
Example: Comparing corrie orientations
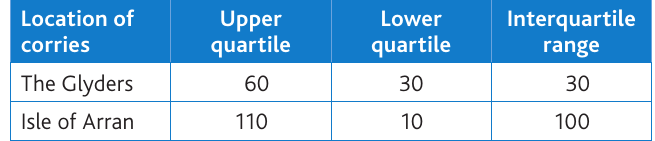
This table shows quartile data for corrie lip orientations in two locations. Notice how the Isle of Arran has a much larger IQR (100) compared to the Glyders (30). This tells us that the middle 50% of Arran's corrie orientations are much more varied, whilst the Glyders show more consistency in orientation.
Standard deviation
Standard deviation is the most sophisticated measure of dispersion. It tells us how much, on average, each value in our dataset differs from the mean. This measure is particularly valuable because it uses all the data values and links to important statistical concepts like the normal distribution.
Calculating standard deviation
The calculation involves five key steps:
- Find the difference between each value and the mean
- Square each difference to eliminate negative values:
- Total all the squared differences:
- Divide by the number of values to find the variance:
- Take the square root of the variance to get standard deviation
The formula looks like this:
Where:
- = individual values
- = mean of all values
- = number of values
- = sum of
The variance is the value you get before taking the square root (step 4). Standard deviation is the square root of variance. Remember: "Variance before deviation" - variance is the intermediate step in the calculation.
Example calculation
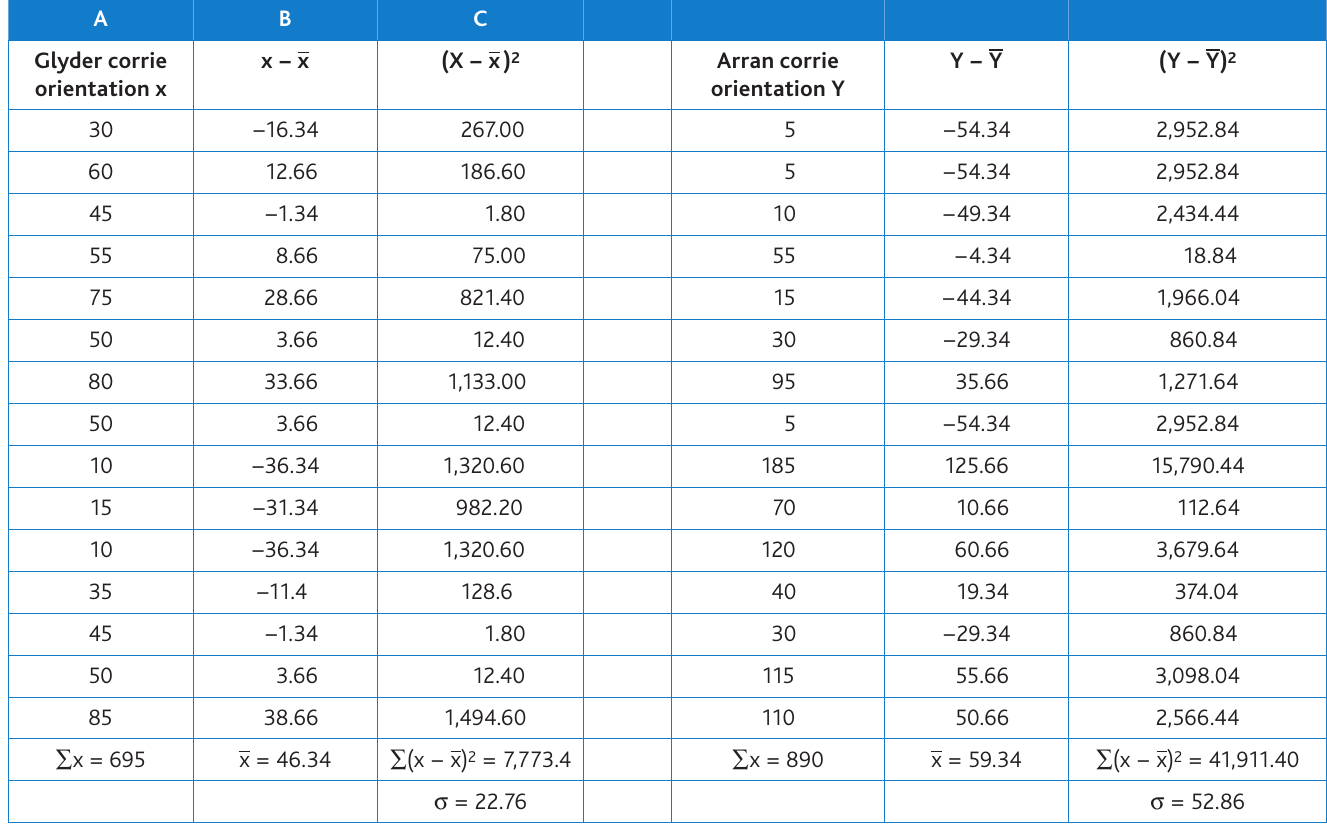
Worked Example: Calculating Standard Deviation
This table demonstrates the full calculation process for two datasets: Glyder corrie orientations and Arran corrie orientations.
For the Glyders:
- Mean
- Sum of squared differences
- Standard deviation
For Arran:
- Mean
- Sum of squared differences
- Standard deviation
The normal distribution connection
Standard deviation is statistically important because it links datasets to the normal distribution (also called a bell curve). This connection allows geographers to make meaningful comparisons and predictions.
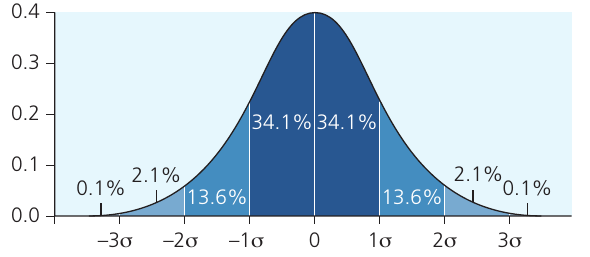
This diagram shows how data is distributed in a normal distribution. The x-axis shows standard deviations from the mean ( to ), with specific percentages of data falling within each range:
- Approximately 68% of values fall within 1 standard deviation of the mean
- Approximately 95% fall within 2 standard deviations
- Approximately 99.7% fall within 3 standard deviations
Interpreting standard deviation
Low standard deviation indicates that data values are clustered closely around the mean. The dispersion is narrow, showing consistency in your measurements.
High standard deviation indicates that data values are widely spread out from the mean. The dispersion is large, showing considerable variation in your measurements.
In our corrie example, Arran's higher standard deviation () compared to the Glyders () confirms what we saw with the other measures - there is much greater variation in corrie orientations on Arran.
Why use standard deviation?
Standard deviation is more powerful than range or IQR because it:
- Uses every single value in your dataset
- Shows the typical amount of variation from the mean
- Allows comparison between different datasets
- Connects to the normal distribution for further statistical analysis
- Provides a basis for more advanced statistical tests
Key Points to Remember:
-
Range is the quickest measure but can be distorted by extreme values - it's the difference between maximum and minimum values
-
Inter-quartile range (IQR) focuses on the middle 50% of data around the median, making it more reliable than range as it ignores extreme values
-
Standard deviation is the most comprehensive measure as it uses all data values and shows how much values typically differ from the mean
-
A low standard deviation means data is tightly clustered; a high standard deviation means data is widely spread
-
Standard deviation connects to the normal distribution, where approximately 68% of values fall within one standard deviation of the mean