Velocity-Time Graphs (AQA A-Level Mathematics): Revision Notes
📚 Revision Notes
2.1.2 Velocity-Time Graphs
V-T and S-T Graphs
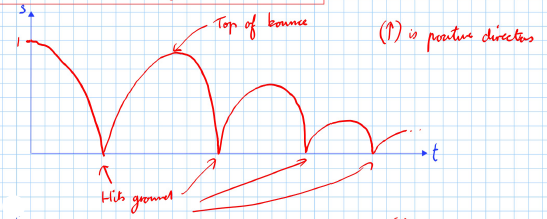
A ball is bouncing on the ground. It is released from a height of 1 m above the ground.
S-T Graph
Assumptions:
- The ground is s = 0.
- g is positive direction (acceleration due to gravity).
Graph Explanation:
- The graph shows a series of parabolic curves representing the motion of the ball as it bounces.
- The ball hits the ground and then changes direction at the moment of bounce.
- Each bounce reaches a lower height until the ball eventually stops.
V-T Graph
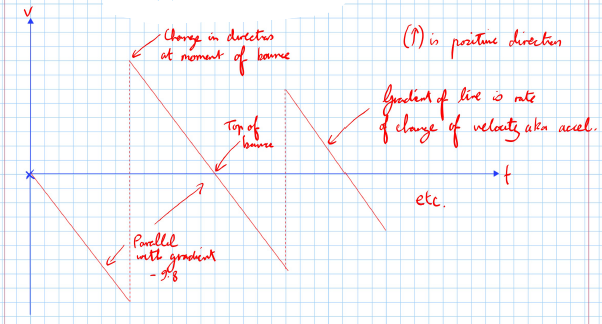
- g is positive direction (acceleration due to gravity).
- The graph shows a series of straight lines with negative slopes, indicating the decrease in velocity as the ball moves upwards and increases in the downward direction.
- The gradient of the line represents the rate of change of velocity, also known as acceleration.
- The velocity reaches zero at the top of each bounce before reversing direction.
- The lines are parallel, with a gradient of -9.8 m/s², showing constant acceleration due to gravity during the ball's motion.
Features of an S-T Graph

- At time t = 6, the displacement is 10 m.
- At t = 6 ≤ t ≤ 20, the particle does not displace itself further; it is at rest.
- At t = 24, the particle has displacement 0 m.
- During this fascinating episode, the particle has travelled a distance of 20 m.
- For 0 ≤ t ≤ 6:
- Its velocity is ΔS/Δt = 10/6 = 5/3 ms⁻¹.
- For 20 ≤ t ≤ 24:
- Its velocity is ΔS/Δt = -10/4 = -2.5 ms⁻¹.
- For 20 ≤ t ≤ 24:
- Its speed is 2.5 ms⁻¹.
- For 0 ≤ t ≤ 24:
- Its average velocity is ΔS/Δt = 0/24 = 0 ms⁻¹.
- For 0 ≤ t ≤ 24:
- Its average speed is 20/24 = 5/6 ms⁻¹.
Key Points
infoNote
- Velocity is ΔS/Δt where S is displacement.
- Speed is d/Δt where d is distance travelled.
- Velocity is the gradient of an S-T graph.
Features of a V-T Graph
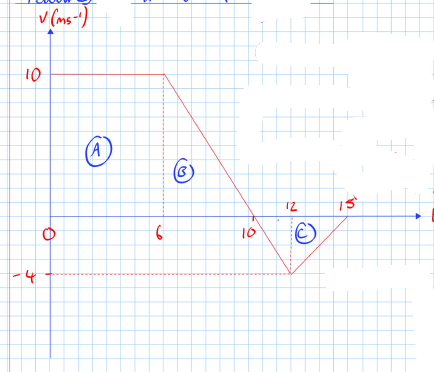
- For 0 ≤ t ≤ 6:
- Moving at a constant velocity of 10 ms⁻¹.
- For 6 ≤ t ≤ 10:
- Velocity decreases at a constant rate of ΔV/Δt = (10 - 2)/4 = 2 ms⁻².
- For 10 ≤ t ≤ 12:
- Change in direction with decrease in velocity/increase in speed.
- For 12 ≤ t ≤ 15:
- Decrease in speed but accelerating positively at a rate of 4/3 ms⁻².
Total Displacement Calculation
The total displacement is the sum of all the individual areas between the graph and the x-axis, including their signs.
- Total displacement from 0 ≤ t ≤ 15:
- A = 6 × 10 = 60 m
- B = (10 × 4)/2 = 20 m
- C = (5 × -4)/2 = -10 m
- Total displacement: 60 + 20 - 10 = 70 m
- Total distance travelled: 60 + 20 + 10 = 90 m
Key Points
infoNote
- Displacement is the total area between the graph and the x-axis, including signs (i.e., areas under the x-axis contribute negatively).
- Distance is the above process but ignoring negatives.
- Acceleration is the gradient at a given point.