Elections and Referendums (AQA A-Level Politics): Revision Notes
Advantages and Disadvantages of Different Electoral Systems
Introduction to UK electoral systems
The UK uses several different electoral systems for various elections. Understanding how these systems work and their strengths and weaknesses is essential for evaluating democratic representation and electoral reform.
Five main electoral systems used in the UK:
- First-past-the-post (FPTP): used in general elections and English local elections
- Party list proportional representation (List PR): used in European elections (until Brexit)
- Additional member system (AMS): used in Scottish and Welsh parliaments
- Single transferable vote (STV): used in Northern Ireland Assembly and Scottish local council elections
- Alternative vote (AV): used to elect parliamentary select committee chairs
These different systems can produce vastly different election results from the same voting data. The choice of electoral system has significant implications for government formation, party representation, and voter influence.
The UK is unusual in using multiple electoral systems for different types of elections. Most democracies use a single system across all elections, which provides consistency but may not be suited to all types of representation. The UK's varied approach allows different systems to be tested and compared in real-world contexts.
How different systems produce different results
Using the 2019 general election results, we can see how different electoral systems would have allocated seats differently:
| Party | Vote share | FPTP | List PR | AMS | STV |
|---|---|---|---|---|---|
| Conservative | 43.6% | 365 MPs | 288 MPs | 284 MPs | 312 MPs |
| Labour | 32.1% | 202 MPs | 216 MPs | 188 MPs | 221 MPs |
| Liberal Democrats | 11.5% | 11 MPs | 70 MPs | 79 MPs | 59 MPs |
| SNP | 3.9% | 48 MPs | 28 MPs | 26 MPs | 30 MPs |
| Plaid Cymru | 0.5% | 4 MPs | 12 MPs | 5 MPs | 5 MPs |
| Green | 2.7% | 1 MP | 4 MPs | 38 MPs | 2 MPs |
| Brexit | 2% | 0 MPs | 11 MPs | 12 MPs | 3 MPs |
| Others | 1% | 0 MPs | 3 MPs | 0 MPs | 0 MPs |
Key observations from this comparison:
- Only FPTP produced a government with an overall Commons majority
- The Conservatives and SNP gained fewer MPs under alternative systems
- The Liberal Democrats would benefit most from electoral reform
- Smaller parties (Green and Brexit) performed best under AMS and List PR
Electoral systems are not neutral - they significantly affect which parties gain representation and who forms the government. The same votes can produce dramatically different outcomes depending on the counting method used. This demonstrates why the choice of electoral system is a fundamentally political decision with major consequences for democratic representation.
First-past-the-post (FPTP)
How FPTP works:
FPTP operates on the majoritarian principle. The candidate with the largest number of votes in each constituency wins the seat. Runners-up receive no electoral reward, regardless of how close the contest is. The UK is divided into 650 single-member constituencies, with each electing one MP.
Worked Example: 2019 Great Grimsby Constituency
| Candidate | Party | Votes |
|---|---|---|
| Lia Nici | Conservative | 18,150 (elected) |
| Melanie Onn | Labour | 10,819 |
| Christopher Barker | Brexit | 2,378 |
| Ian Barfield | Liberal Democrats | 1,070 |
| Loyd Emmerson | Green | 514 |
| Nigel Winn | Independent | 156 |
Conservative majority: 7,331
In this example, the Conservative candidate won despite receiving only 45% of the total votes cast. The other 55% of votes had no impact on the outcome - these are often called "wasted votes" as they did not contribute to electing any representative.
Advantages of FPTP:
- Produces strong government: Traditionally delivers single-party governments with clear Commons majorities, enabling decisive policy-making
- Simple and familiar: Easy for voters to understand and quick to count
- Strong constituency link: Each MP represents a specific geographic area and is directly accountable to local voters
- Excludes extremist parties: High threshold for winning seats prevents fringe parties gaining representation
- Avoids coalition deals: No need for post-election negotiations that can dilute manifesto promises
- Quick results: Straightforward counting means results declared soon after polls close
Disadvantages of FPTP:
- Disproportionate results: Seat distribution does not reflect vote share. In 2019, the Conservatives won 77 more seats than their vote proportion entitled them to
- Wasted votes: Many votes have no impact, particularly in safe seats and for smaller parties. The Brexit Party won 644,257 votes but no MPs in 2019
- Winner's bonus: Exaggerates winning party's success. In 1997, Labour won 63% of seats on just 43% of the vote
- Discriminates against smaller parties: The Green Party won 2.7% of the vote but only 0.2% of seats in 2019
- Can produce 'wrong winner': On rare occasions (1951, February 1974), the party with most votes did not win most seats
- Encourages tactical voting: Voters may vote for their second choice to prevent their least favourite winning
- MPs without majority support: In 2019, 229 out of 650 MPs were elected with less than 50% support in their constituency
FPTP creates "safe seats" where the outcome is predictable election after election. This can lead to lower voter engagement in these constituencies, as many voters feel their vote won't change the result. Conversely, "marginal seats" with close contests often see higher turnout and receive disproportionate attention from parties during campaigns.
Party list proportional representation (List PR)
How List PR works:
Instead of single-member constituencies, List PR uses larger multi-member regions. Each region elects multiple MPs in proportion to vote share. The UK might be divided into 26 large constituencies, each electing 25 MPs.
Parties rank their candidates on a list. The highest-ranked candidates for successful parties are elected. Party leaders and senior figures typically occupy top positions, making their election almost certain.
The D'Hondt system:
List PR in the UK used the D'Hondt method, which allocates seats in successive rounds:
- In each round, divide each party's total votes by (seats already won + 1)
- The party with the highest remaining total wins that round's seat
- Repeat until all seats allocated
Worked Example: 2019 South East England European Election (10 MEPs)
The D'Hondt method allocates seats through successive rounds of division:
| Round | Brexit | Liberal Democrats | Green | Conservative | Labour | Winner |
|---|---|---|---|---|---|---|
| 1 | 915,686 | 653,743 | 343,249 | 260,277 | 184,678 | Brexit |
| 2 | 457,843 | 653,743 | 343,249 | 260,277 | 184,678 | Liberal Democrats |
| 3 | 457,843 | 326,872 | 343,249 | 260,277 | 184,678 | Brexit |
| 4 | 305,229 | 326,872 | 343,249 | 260,277 | 184,678 | Green |
| 5 | 305,229 | 326,872 | 171,625 | 260,277 | 184,678 | Liberal Democrats |
| 6 | 305,229 | 217,914 | 171,625 | 260,277 | 184,678 | Brexit |
| 7 | 228,922 | 217,914 | 171,625 | 260,277 | 184,678 | Conservative |
| 8 | 228,922 | 217,914 | 171,625 | 130,139 | 184,678 | Brexit |
| 9 | 183,137 | 217,914 | 171,625 | 130,139 | 184,678 | Liberal Democrats |
| 10 | 183,137 | 163,436 | 171,625 | 130,139 | 184,678 | Labour |
| Total | 4 | 3 | 1 | 1 | 1 |
Final allocation closely reflected vote share: Brexit won approximately 39% of votes and gained 40% of seats - a highly proportional result that would be impossible under FPTP.
Advantages of List PR:
- Highly proportional: Seat distribution accurately reflects vote share
- Fewer wasted votes: Wider range of parties can win seats
- Fair to smaller parties: Parties receiving 1-5% of votes can still gain representation
Disadvantages of List PR:
- Inevitably produces coalition government: No single party secures an overall majority, requiring post-election deals
- Weak constituency link: Representatives serve large regions with hundreds of thousands of constituents
- Increases central party power: In closed-list systems, parties control candidate ranking, guaranteeing favoured candidates get elected
- Makes accountability complex: Difficult to reward or punish individual parties in coalition governments
- Can empower small parties: Smaller parties may become 'king-makers' with disproportionate influence
The term "closed-list" refers to systems where parties determine candidate rankings and voters can only choose between parties. In "open-list" systems, voters can indicate preferences for individual candidates within their chosen party, giving voters more control over which specific people get elected.
Additional member system (AMS)
How AMS works:
AMS is a hybrid system combining FPTP and List PR. It is used for the Scottish Parliament, Welsh Senedd, and London Assembly.
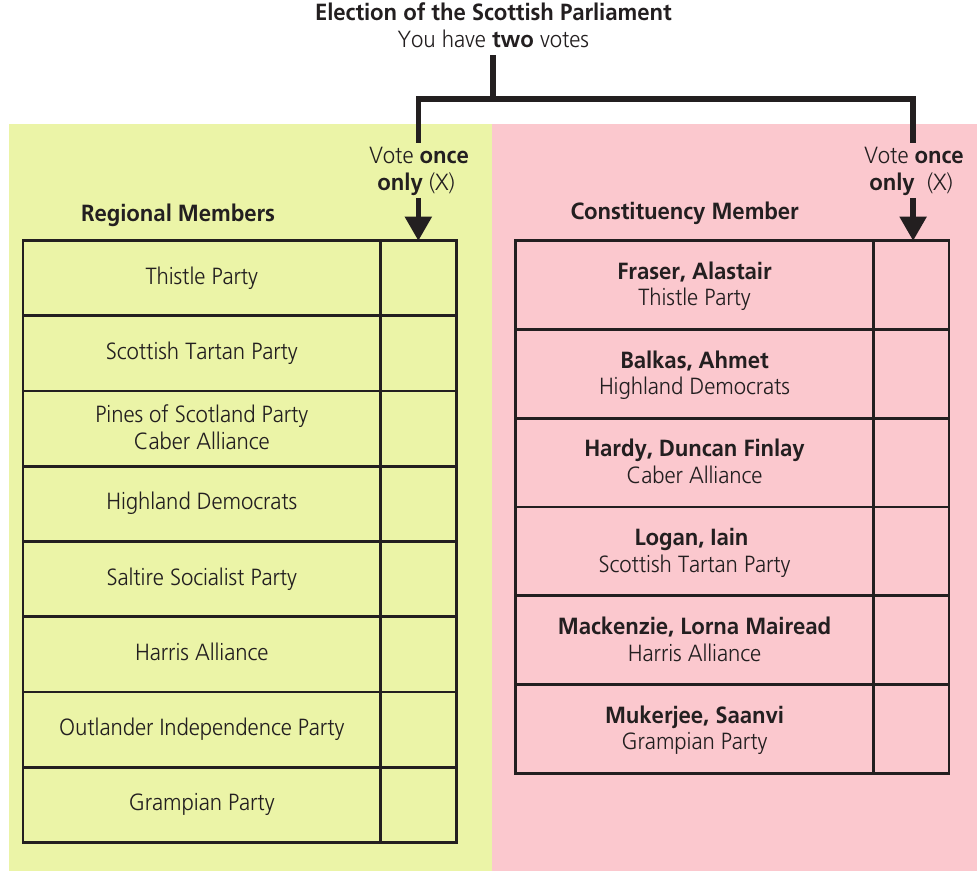
Voters receive two ballot papers and cast two votes:
- Constituency vote: Choose a candidate to represent the local constituency (elected by FPTP)
- Regional list vote: Choose a party for the wider region
In Scotland, 73 MSPs are elected from constituencies and 56 from regional lists. Scotland is divided into eight regions for list seats.
How regional list seats are allocated:
Regional list seats 'top up' any underrepresentation from constituency results. If a party wins fewer constituency seats than its overall vote share entitles it to, the shortfall is made up from regional list seats.
Worked Example: 2016 Edinburgh Western Constituency and Lothians Region
Constituency Result:
| Candidate | Party | Votes cast |
|---|---|---|
| Alex Cole-Hamilton | Scottish Liberal Democrats | 16,645 |
| Toni Giugliano | Scottish National Party (SNP) | 13,685 |
| Sandy Batho | Scottish Conservative & Unionist | 5,686 |
| Cat Headley | Scottish Labour | 3,750 |
MSP elected: Alex Cole-Hamilton
Lothians Region 2016 Results:
The Lothians region encompasses nine constituencies, including Edinburgh Western.
Constituency seats won:
- SNP: 6 seats
- Scottish Conservatives: 1 seat
- Scottish Liberal Democrats: 1 seat
- Scottish Labour: 1 seat
Regional list vote shares:
- SNP: 38%
- Scottish Conservatives: 24%
- Scottish Liberal Democrats: 6%
- Scottish Labour: 21%
- Scottish Green Party: 11%
Top-up allocation:
With 16 total MSPs (9 constituency + 7 regional list), the seven regional list seats were allocated to produce a more proportional outcome:
- SNP: 0 additional (6 total) - already overrepresented
- Scottish Conservatives: 3 additional (4 total)
- Scottish Liberal Democrats: 0 additional (1 total)
- Scottish Labour: 2 additional (3 total)
- Scottish Green Party: 2 additional (2 total) - won no constituencies but gained representation through lists
This demonstrates how the top-up mechanism corrects disproportionality from the constituency results.
Advantages of AMS:
- More proportional than FPTP: Produces fairer overall results through the top-up mechanism
- Maintains constituency link: Constituency members provide local representation
- Allows vote splitting: Voters can support different parties with each vote
- Helps smaller parties: Regional lists enable parties without constituency seats to gain representation
Disadvantages of AMS:
- Creates two-tier system: Distinction between directly elected constituency members and list members may affect perceived legitimacy
- Typically produces minority government: Like full PR systems, coalition government is the norm
- More complex than FPTP: Requires two ballot papers and more complicated counting
- Increases central party power: Parties control ranking of regional list candidates
AMS is designed to balance the benefits of FPTP (constituency representation) with the fairness of PR (proportional outcomes). However, this compromise creates potential tensions between constituency MSPs who represent specific areas and regional list MSPs who represent broader regions. Some critics argue this creates "two classes" of representatives.
Single transferable vote (STV)
How STV works:
STV uses multi-member constituencies where voters rank candidates in order of preference. This system is used for Northern Ireland Assembly elections and Scottish local council elections.
The counting process:
- Calculate a quota based on: (total votes cast) ÷ (seats + 1) + 1
- Candidates exceeding the quota on first preferences are immediately elected
- Surplus votes (votes above the quota) are redistributed according to second preferences
- If seats remain unfilled, the candidate with fewest votes is eliminated
- Eliminated candidate's votes are redistributed according to voters' next preferences
- Process continues until all seats filled
Worked Example: 2019 Northern Ireland European Election
Three MEPs were elected with a quota of 143,112 votes needed.
| Party | Candidate | First preference % | Count 1 | Count 2 | Count 3 | Count 4 | Count 5 |
|---|---|---|---|---|---|---|---|
| Sinn Féin | Martina Anderson | 22.17 | 126,951 | 128,117 | 128,190 | 128,200.50 | 152,436.50 (elected) |
| DUP | Diane Dodds | 21.83 | 124,991 | 127,291 | 155,422 (elected) | ||
| Alliance | Naomi Long | 18.50 | 105,928 | 115,327 | 122,263 | 123,917.00 | 170,370.00 (elected) |
| SDLP | Colum Eastwood | 13.72 | 78,589 | 80,949 | 82,101 | 82,413.50 | |
| TUV | Jim Allister | 10.83 | 62,021 | 63,872 | 79,540 | 89,854.00 | 90,079.00 |
It took five counts before all three MEPs were elected. Diane Dodds was elected at count 3 when she reached the quota, while Martina Anderson and Naomi Long were both elected at count 5 as the final two candidates with the most votes.
Notice how votes were redistributed multiple times, ensuring fewer wasted votes compared to FPTP.
Advantages of STV:
- Proportional results: Accurately reflects overall vote shares
- Reduces wasted votes: Preferential voting means votes transfer rather than being wasted
- No tactical voting needed: Voters can rank candidates honestly without fear of wasting their vote
- Voter choice: In larger constituencies, voters can choose between candidates from the same party
- Maintains geographic representation: All representatives serve a geographic area (though larger than FPTP constituencies)
- Supports independents: Better vote value means independent candidates have realistic chances
Disadvantages of STV:
- Complex and time-consuming: Most complicated system to understand and count. In the Republic of Ireland, counting took two full days
- Creates coalition government: Proportional results make single-party government unlikely
- Larger constituencies: Each representative covers a much larger area than under FPTP
- May not offer party choice: If constituencies elect only 3-4 members, parties typically field just one candidate each
STV is considered by many electoral reform advocates to be the "gold standard" of electoral systems because it combines proportionality with voter choice and maintains geographic representation. However, its complexity is a significant barrier to wider adoption, as evidenced by the lengthy counting processes required.
Alternative vote (AV)
How AV works:
AV uses single-member constituencies like FPTP, but voters rank candidates in order of preference. This system is currently used only for electing parliamentary select committee chairs in the UK. It was proposed for general elections in a 2011 referendum but was rejected by 68% of voters.
The counting process:
- If a candidate receives more than 50% of first preference votes, they are elected
- If not, the candidate with fewest votes is eliminated
- Their second preference votes are redistributed to remaining candidates
- Process repeats until one candidate has at least 50% support
Worked Example: January 2020 Defence Select Committee Chair Election
| Candidate | First stage | Second stage (Gray eliminated) | Third stage (Holloway eliminated) | Fourth stage (Courts eliminated) |
|---|---|---|---|---|
| Robert Courts | 62 | 68 | 81 | — |
| Tobias Ellwood | 243 | 256 | 271 | 296 (elected) |
| James Gray | 39 | — | — | — |
| Adam Holloway | 45 | 48 | — | — |
| Sir Bernard Jenkin | 173 | 183 | 193 | 226 |
Total votes cast: 562
Votes required to win: 282
Tobias Ellwood was elected after four rounds of counting when he finally achieved majority support through the redistribution of eliminated candidates' votes. Notice how no candidate had a majority initially, but the preferential voting system ensured the winner had support from at least 50% of voters.
Advantages of AV:
- Majority support: Winning candidate has support (at least as second/third choice) from majority of voters
- Reduces wasted votes: Votes transfer rather than being discarded
- Eliminates tactical voting: Voters can express genuine preferences without strategic considerations
- Retains constituency link: Single-member constituencies maintain strong MP-constituent relationship
- Simple to understand: Relatively straightforward system with one MP per constituency
Disadvantages of AV:
- Not proportional: Studies suggest AV could produce even less proportional results than FPTP
- May favour centrist candidates: Those seen as 'least worst' may win on second/third preferences rather than genuine enthusiasm
- Untested in major elections: No European countries currently use AV for national elections
- No guarantee of strong government: Could still produce hung parliaments
Despite being rejected in the 2011 referendum, AV remains significant in debates about electoral reform. It represents a "middle ground" option - more sophisticated than FPTP but less radical than proportional systems. However, critics from both sides argue it fails to satisfy either the desire for simple majoritarian government or the goal of proportional representation.
Comprehensive evaluation of electoral systems
Electoral systems can be evaluated against several key criteria. This comprehensive comparison helps assess which system best serves democratic principles.
Proportionality and fairness
FPTP:
Seat distribution rarely reflects vote share, creating significant distortions, particularly with landslide results. The system produces a 'winner's bonus' - in 1997, Labour won 63% of seats on 43% of votes, and in 1983, Conservatives won 61% of seats on 42% of votes.
On rare but notable occasions, the party with most votes doesn't always win most seats (1951, February 1974). This fundamentally challenges the democratic legitimacy of FPTP, as it can produce a "wrong winner" where the less popular party forms the government.
The system heavily discriminates against smaller parties. The Green Party won 2.7% of the vote but only 0.2% of seats in 2019.
List PR:
List PR is highly proportional - seats closely match vote share. In the South East England European election, the Brexit Party won 39% of votes and gained 40% of seats. The system is very fair to smaller parties, ensuring even minor parties gain representation proportional to their support.
AMS:
AMS provides a balanced system between FPTP and full PR. In the Lothians region 2016, Scottish Conservatives won 25% of seats on 24% vote share, and Scottish Greens won 12.5% of seats on 11% vote share. This demonstrates significantly more proportional outcomes than FPTP while maintaining some constituency representation.
STV:
As a proportional system, STV delivers results that accurately reflect vote share. The Electoral Reform Society considers it the most proportional system. Voters don't need to worry about vote splitting or tactical voting, as their preferences ensure their vote contributes to the outcome.
AV:
AV is not a proportional system. Studies of the 2017 election suggest it would have been less proportional than FPTP. Liberal Democrats and nationalist parties would have won fewer seats. However, it does ensure the winning candidate has at least tacit support of the majority.
Vote value and wasted votes
FPTP:
Many votes are wasted under FPTP. Safe seat voters feel their votes make no difference, and thousands of votes for smaller parties often result in no MPs. The Brexit Party won 644,257 votes but 0 MPs in 2019. The system is biased toward the two main parties and geographically concentrated regional parties.
A "wasted vote" doesn't mean the vote wasn't counted - it means the vote did not contribute to electing any representative. This includes votes for losing candidates and surplus votes for winning candidates beyond what they needed to win.
List PR:
There is much less chance of wasted votes under List PR. A wider range of parties can win seats, ensuring more voters see their preferred party gain representation. However, even parties with 1-5% of the national vote may not win regional seats if regions are too small.
AMS:
AMS reduces the chance of small party votes being wasted. The Scottish Green Party gained two seats despite winning no constituencies, demonstrating how the regional list component ensures broader representation. However, the smallest parties may still not secure seats if regions are too large.
STV:
Preferential voting significantly reduces wasted votes under STV. Even votes for minor parties affect the final outcome through the transfer system, ensuring almost every vote contributes to the final result.
AV:
AV fares relatively well on vote value. There is no disincentive to vote for minor parties or independents, as first preferences are redistributed if a candidate is eliminated. This removes the temptation for tactical voting.
Promoting participation and turnout
FPTP:
Some argue FPTP discourages participation by wasting smaller party votes. However, UK general election turnout has not been in steady decline:
- 2010: 65.1%
- 2015: 66.2%
- 2017: 68.8%
- 2019: 67.3%
Many other factors affect turnout beyond the electoral system, including the perceived importance of the election and the competitiveness of the race.
Turnout is influenced by multiple factors beyond the electoral system: the closeness of the race, the popularity of party leaders, major policy issues, weather conditions, ease of voting access, and broader political engagement in society. Attributing turnout changes solely to the electoral system oversimplifies a complex phenomenon.
List PR:
List PR should theoretically boost turnout as fewer votes are wasted. However, European election turnout was historically very low (36.9% in 2019). This low turnout may reflect wider public interest in European elections rather than the electoral system itself. If used for general elections, turnout might be comparable to FPTP.
AMS:
There is no clear evidence that AMS boosts turnout. Welsh turnout was 67% for the 2019 general election (FPTP) but only 45% for 2016 assembly elections (AMS). This difference likely reflects the importance attached to each election rather than the system itself.
STV:
Northern Ireland European election turnout (45% in 2019) was higher than the rest of the UK. However, Northern Ireland traditionally has high turnout across elections. It is difficult to isolate the effect of the electoral system from other factors affecting participation.
AV:
The absence of wasted votes should theoretically encourage participation under AV. However, there is no firm evidence as AV is not used for public elections in the UK. No European countries currently use AV for national elections, limiting comparative data.
Strong and accountable government
FPTP:
FPTP traditionally produces clear, decisive results with single-party majorities, particularly from 1979-2010 (Thatcher, Major, Blair, Brown governments). However, 2010, 2017, and February 1974 produced hung parliaments, while 2019 returned to the pattern of strong single-party government.
The system makes government accountability straightforward - voters know exactly which party to reward or punish. However, it is questionable whether strong government is always desirable, particularly when it allows governments to implement radical policies with minority vote support.
List PR:
List PR inevitably produces results where no party has an overall majority. The Brexit Party won only 29/73 seats in 2019 European elections. Coalition governments are the rule, not the exception, making it less straightforward to punish or reward individual parties.
Post-election deals and compromises are unavoidable under List PR, which critics argue undermines democratic accountability. Voters cannot know what government will emerge until after negotiations conclude. However, supporters argue that coalition government is preferable to single-party rule by parties that did not win majority support.
Small parties may become 'king-makers' with disproportionate influence, able to demand policy concessions in exchange for supporting larger parties.
AMS:
AMS almost inevitably produces minority government. The SNP only secured an overall majority once (2011) in the Scottish Parliament. However, this has not led to constant instability or deadlock in Scotland or Wales. Multiparty government requires compromise, which supporters view as a strength rather than weakness.
STV:
As a proportional system, STV produces coalition or multiparty government, usually requiring coalition deals and policy compromises. Supporters note that no single party has won 50%+ in UK general elections since 1945, meaning the UK has never actually voted for single-party government under the current system.
AV:
AV is the alternative most likely to produce single-party government aside from FPTP. Many second preference votes are likely to go to main parties, making overall majorities possible. AV would probably reduce extremist representation while maintaining the potential for decisive government.
Local links and constituency representation
FPTP:
FPTP scores highly on local representation. Every constituency has its own MP representing all voters, and MPs are directly accountable to constituents at elections. Many MPs enjoy high local profiles and strong connections to their communities.
List PR:
List PR is weaker on local links. Representatives serve regions with hundreds of thousands of constituents, removing the notion of an MP serving all constituents in a specific area. Voters are more likely to approach an MP from their favoured party rather than their geographic representative.
AMS:
Constituency members provide a local link under AMS. However, the system creates a potential two-tier system: directly elected constituency members versus regional list members. List members may be seen as having a weaker mandate, though they perform the same duties.
STV:
All elected members represent geographic areas under STV, though these areas are larger than FPTP constituencies. Voters can approach a range of representatives, providing choice. However, each representative oversees a much larger area (5+ times bigger than Westminster seats).
AV:
AV provides a clear positive like FPTP, retaining single-member constituencies where one MP represents and looks after all constituents. The system maintains strong local accountability while improving representation through preferential voting.
Power of political parties
FPTP:
FPTP doesn't allow voters to choose between candidates from the same party. Candidates are selected by local party membership from a centrally approved list. However, central party power is more limited than under List PR.
List PR:
List PR can transfer large power to central parties. In closed-list systems, parties decide candidate ranking, guaranteeing favoured candidates get elected while those at the bottom of the list have no chance.
The Electoral Reform Society describes closed-list PR as a system that "empowers parties rather than voters". This democratic deficit could be remedied with an open-list system allowing voter choice between same-party candidates, but this increases complexity significantly.
AMS:
Regional lists grant more power to central parties under AMS. Parties rank candidates as with List PR for the regional component, though constituency members are chosen locally by party members.
STV:
STV allows voters to choose between individual candidates from the same party, empowering voters over party machines. However, this only works if the multi-member constituency is large enough (5+ members). The Northern Ireland example with three MEPs meant parties fielded only one candidate each.
AV:
Like FPTP, candidates under AV are chosen by local activists in branches, maintaining local party democracy in candidate selection.
Party choice and representation
FPTP:
FPTP discriminates against smaller parties but still offers a fair range of representation compared to some countries (e.g., US Congress). There is no evidence FPTP discourages candidates from standing - most constituencies offer a wide range of parties, even if their success chances are remote.
List PR:
List PR ensures a wider range of candidates get elected. In 2009, two BNP (far-right) candidates were elected as MEPs, demonstrating how the system enables even controversial parties to gain representation if they meet the threshold. Smaller parties like Green and UKIP/Brexit had far more MEPs than MPs.
AMS:
Third parties are more likely to gain representation under AMS than FPTP. However, the range of parties in Scottish and Welsh parliaments remains relatively small. In 2016, only main national parties, two nationalist parties, UKIP (Wales), and Green (Scotland) were represented.
STV:
Better vote value under STV creates greater incentive to vote for independents and minor parties. The Republic of Ireland had 19/160 independent representatives after the 2020 election - the only European country using STV aside from Malta shows how the system supports diverse representation.
AV:
AV is likely to favour candidates with broad appeal. However, 2017 projections suggest Liberal Democrats would fare worse despite being 'middle of the road'. Candidates with extreme or polarising views are unlikely to secure 50%+ support, even with transferred preferences.
Comprehensibility and transparency
FPTP:
FPTP scores highly on comprehensibility - it is simple to understand and straightforward to operate. The system provides a clear, quick result soon after the election, with most constituencies declaring within hours of polls closing.
List PR:
List PR is less straightforward and more cumbersome, requiring multiple rounds of counting as demonstrated in the D'Hondt example. However, supporters argue the 'fairer result' justifies the additional complexity.
AMS:
AMS is more complicated than FPTP, requiring two ballot papers and creating two categories of representatives. However, it is relatively straightforward to count and calculate compared to other proportional systems, with no multiple rounds of redistribution like List PR.
STV:
Complexity is probably STV's biggest shortcoming. The system is not particularly straightforward to understand, and calculating the final seat allocation takes considerable time. In the Republic of Ireland, counting took two full days, which some argue undermines public confidence in the process.
AV:
AV is relatively easy to understand - one MP per constituency with preferential voting until someone reaches 50%. It is simpler than most alternatives while still offering improvements over FPTP.
Should FPTP be replaced for Westminster elections?
This remains one of the most significant debates in UK politics. The arguments reflect fundamental disagreements about what makes a democratic electoral system effective.
Arguments for replacing FPTP:
Proportionality and fairness:
Other systems like STV and List PR better reflect vote share. FPTP often distorts results, especially with landslide results. The UK is the only European country using FPTP, suggesting most democracies have concluded that alternative systems better serve democratic principles.
Vote value:
Many votes are 'wasted', particularly for smaller parties or in safe seats. The system encourages tactical voting, especially in marginal constituencies, meaning voters cannot express their genuine preferences without potentially helping their least-preferred candidate.
Party representation:
FPTP discriminates against smaller parties. Many single-party governments are elected on low vote share - the Conservatives won in 2015 with just 37% of the vote but governed with a majority, meaning 63% of voters opposed the governing party.
Democratic legitimacy:
The party with most votes doesn't always win most seats (1951, February 1974). Many MPs are elected without majority support in their constituency. The system does not always produce strong single-party majority governments (2017), undermining claims that this is FPTP's main advantage.
Electoral reform advocates argue that modern democracies should ensure governments have genuine majority support. They point out that coalition governments in other European countries have proven stable and effective, suggesting the UK's preference for single-party rule is a cultural choice rather than a democratic necessity.
Arguments for retaining FPTP:
Government formation:
FPTP traditionally produces strong, relatively stable governments with a clear ability to govern. This enhances opportunities to hold government accountable at the next election. Strong single-party governments avoid secretive post-election coalition deals that may dilute manifesto promises.
Simplicity and tradition:
The system is easy to understand and familiar to voters. It is quick and straightforward to count votes and declare results, with most constituencies reporting within hours of polls closing.
Representation:
FPTP enables a strong link between MPs and their constituents. The system is used in the USA, which supporters describe as "arguably the most significant democracy in the world", suggesting FPTP is compatible with democratic success.
Political culture:
By favouring two dominant parties, FPTP forces them to have broad appeal. The main parties resemble internal coalitions, bringing together diverse viewpoints. The system keeps small and extremist parties out of parliament and government, preventing fragmentation.
System comparison:
None of the alternative systems are without flaws. Proportional systems guarantee coalition government, which may not suit the UK's political culture. Alternative systems are more complex and may confuse voters.
The electoral reform debate ultimately concerns competing democratic values: Should the system prioritize proportional representation and ensuring all votes count equally? Or should it prioritize strong, accountable government and clear local representation? There is no objectively "correct" answer - it depends on which democratic principles you value most highly.
Key Electoral Systems in the UK:
- FPTP: Single-member constituencies, candidate with most votes wins, currently used for general elections
- List PR: Multi-member regions, seats allocated proportionally using D'Hondt method
- AMS: Hybrid system combining constituency members (FPTP) with regional list members (PR)
- STV: Multi-member constituencies with preferential voting and quota system
- AV: Single-member constituencies with preferential voting until candidate reaches 50%
Critical Evaluation Points:
Proportionality: PR systems (List PR, STV, AMS) produce more proportional results than majoritarian systems (FPTP, AV). FPTP can significantly distort vote share into seats - in 2019, Conservatives won 56% of seats on 43.6% vote share, while Greens won 0.2% of seats on 2.7% vote share.
Government formation: FPTP is more likely to produce single-party majority government; PR systems typically produce coalitions. Whether this is an advantage depends on whether you value strong government or proportional representation.
Vote value: Many votes are "wasted" under FPTP, especially for smaller parties and in safe seats. Proportional systems reduce wasted votes significantly. The Brexit Party won 644,257 votes but no MPs under FPTP in 2019.
Local representation: FPTP and AV maintain strong constituency links. List PR weakens this connection significantly. AMS and STV offer compromise positions with larger constituencies but maintained geographic representation.
Party power: Closed-list PR systems give parties most control over who gets elected. FPTP, AV, and STV give voters more say in candidate selection, empowering voters over party machines.
Key Examples to Remember:
- 2019 election distortion: Under FPTP, Conservatives won 365 seats (56%) on 43.6% vote share; Greens won 1 seat (0.2%) on 2.7% vote share
- Alternative outcomes: The same 2019 votes would have produced dramatically different results under alternative systems (see comparison table)
- STV in practice: Republic of Ireland uses STV and has a significant number of independent representatives (19/160 in 2020)
- AMS in devolution: Scotland and Wales use AMS for devolved parliaments, producing more proportional results than Westminster while maintaining constituency links