Distribution and Abundance of Species (OCR A-Level Biology A): Revision Notes
Distribution and Abundance of Species
Understanding biodiversity measurements
Measuring biodiversity involves more than simply creating a species list. While species richness (the total number of different species in an area) provides important information, it does not reveal the full picture of an ecosystem's biodiversity.


A species list is qualitative — it identifies which species are present but provides no information about how common or rare each species is. For example, one species might dominate an area while all others are rare, or the species might be evenly distributed. These two scenarios represent very different levels of biodiversity despite having identical species richness.
The distinction between qualitative and quantitative data is crucial in ecology. A qualitative species list tells you "what is there" but not "how much" — limiting its usefulness for comparing different habitats or monitoring changes over time.
Species evenness measures the relative abundance of different species in an area. High species evenness, where all species are present in similar numbers, indicates high biodiversity. Low species evenness, where one or a few species dominate, indicates lower biodiversity even if species richness is high.
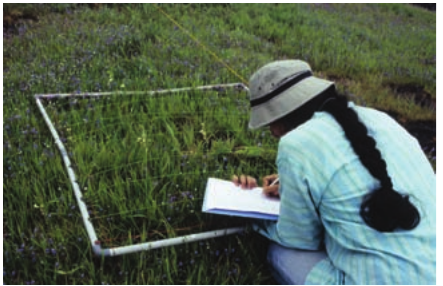
Quadrat sampling methods
The quadrat is the standard apparatus for assessing the abundance of species in an area. Quadrats create defined sampling areas of known size, allowing researchers to make comparable measurements across a habitat.
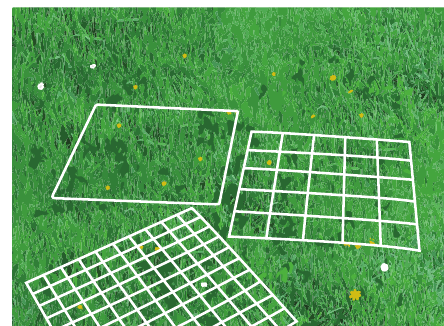
Types of quadrats
Three main types of quadrat are used in ecological surveys:
- Open frame quadrats: Simple squares of known area, typically or , used for counting individual organisms
- Gridded quadrats: Divided by wires or string into smaller sections (commonly or grids), making percentage cover estimation easier
- Large-scale quadrats: Marked out using tape or GPS coordinates, used for surveying large areas or trees
Measuring abundance with quadrats
Quadrats enable three different methods of measuring species abundance, each suited to different situations and species types.
Species frequency is the percentage of quadrats that contain a particular species. Calculate this by dividing the number of quadrats containing the species by the total number of quadrats sampled, then multiply by .
Species density counts individual organisms within quadrats and expresses the result as numbers per unit area (usually per ). This method works well for discrete individual plants or slow-moving animals but becomes impractical for very abundant or difficult-to-separate species.
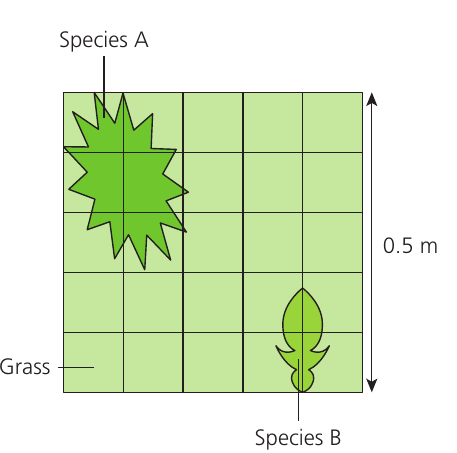
Percentage cover estimates the proportion of the quadrat area occupied by each species. This is the most practical method for abundant species like grasses where counting individuals is impossible. Each grid square in a gridded quadrat represents of the total area, simplifying estimation.
Choosing the Right Measurement Method:
- Use frequency when presence/absence is more practical than counting
- Use density for discrete, countable organisms (individual plants, slow-moving animals)
- Use percentage cover for abundant or mat-forming species where individual counting is impossible (grasses, mosses, algae)
Worked Example: Calculating Frequency and Density
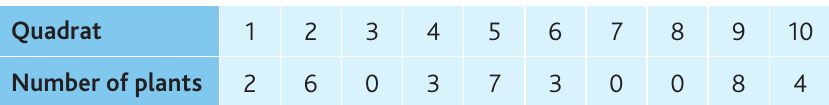
Using the dandelion data shown:
- Dandelions appeared in quadrats , , , , , , and — a total of out of quadrats
- Species frequency =
For density calculation:
- Total dandelions counted = plants
- Total area sampled =
- Species density = plants per
Selecting appropriate quadrat size
The quadrat must be large enough to include a reasonable number of species but small enough to be practical. Too small, and many quadrats will be empty; too large, and sampling becomes time-consuming.
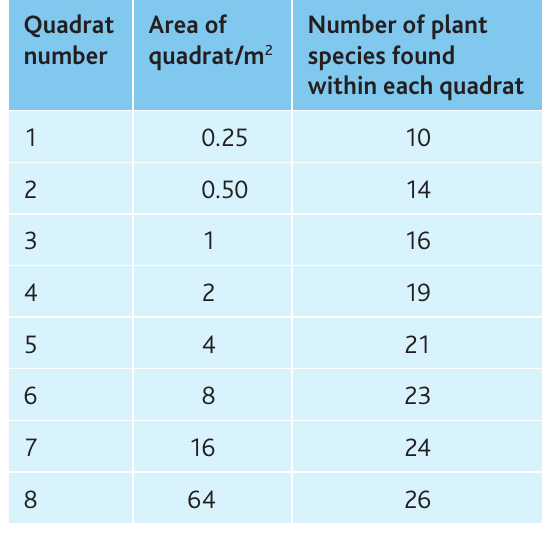
Researchers test different quadrat sizes and plot species number against area. When the graph levels off (species number becomes relatively constant), the quadrat size is appropriate. In the example shown, species number continues increasing up to , but the rate of increase slows considerably after . Practical considerations often mean using smaller quadrats () with more samples rather than fewer very large quadrats.
Random sampling
Random sampling prevents bias in data collection. If researchers only sampled easy-to-reach areas or visually interesting patches, results would not represent the whole habitat accurately.
Why Random Sampling Matters: Human observers naturally gravitate toward interesting or accessible areas. Random sampling ensures every part of the habitat has an equal chance of selection, producing data that truly represents the entire study area rather than just the convenient or unusual parts.
The random sampling procedure involves:
- Lay two tape measures at right angles along two edges of the study area
- Generate random number pairs using a calculator or mobile app
- Use these as coordinates to position each quadrat
- Sample at each randomly selected location
Random sampling ensures that every part of the habitat has an equal chance of being sampled. If the habitat is uniform, sampling of the total area provides representative data.
Sampling mobile animals
Quadrats work well for plants and slow-moving animals but are ineffective for mobile species. Several alternative methods exist for sampling animals that move quickly or avoid detection:
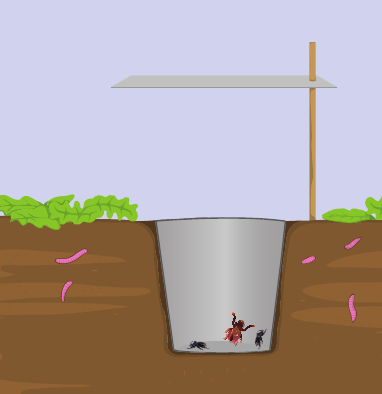
- Pitfall traps: Jars buried in the ground with sheltering material (paper/cardboard) and a rain cover, collecting ground-dwelling invertebrates
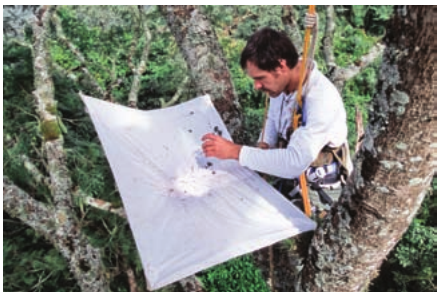
- Beating trays: White sheets placed under trees which are then shaken, dislodging invertebrates for collection
- Sweep nets: For catching flying insects or those in long grass
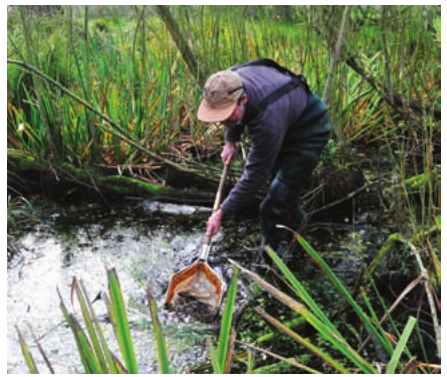
- Pond nets: Strong nets for collecting aquatic organisms
- Pooters: Small devices for collecting tiny invertebrates by suction
Estimating population size using mark-release-recapture
The Lincoln index estimates population sizes of mobile animals through a mark-release-recapture process, providing quantitative data when direct counting is impossible.
The mark-release-recapture procedure:
- Capture a sample of animals () and mark them harmlessly (e.g., non-toxic paint on snail shells, fur clipping on small mammals)
- Release the marked animals back into the habitat
- Allow time for marked individuals to mix thoroughly with the unmarked population
- Recapture a second sample () and count how many are marked
- Calculate population size using the Lincoln index formula
The logic behind this method: if many marked individuals appear in the second sample, the total population must be small. If few marked individuals are recaptured, the total population is large.
Worked Example: Pond Snail Populations
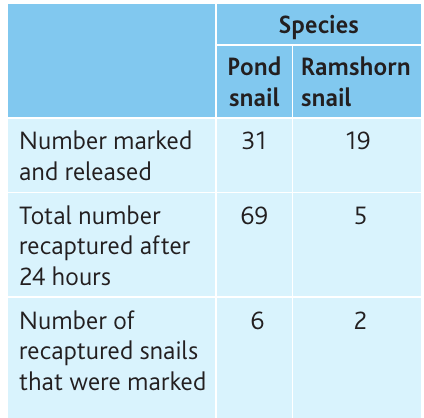
For pond snails:
For ramshorn snails:
Critical Assumptions for Mark-Release-Recapture:
- Marks must not harm animals or make them more visible to predators
- Sufficient time must elapse for mixing (typically hours)
- The population must be closed (no births, deaths, immigration, or emigration between samples)
- Marked and unmarked individuals must have equal chances of recapture
- Marks must remain visible throughout the study period
Simpson's index of diversity
Simpson's index of diversity () combines species richness and evenness into a single value, making biodiversity comparison between sites straightforward. This index is more informative than species richness alone because it accounts for both the number of species and how evenly distributed they are.
The formula is:
Where:
- = number of individuals of each species
- = total number of all individuals
- means "sum of"
Worked Example: Calculating Simpson's Index
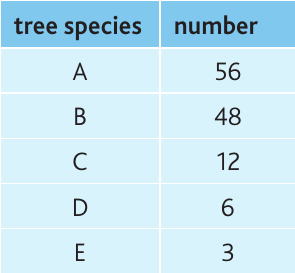
| Species | Number () | ||
|---|---|---|---|
| dandelion | |||
| daisy | |||
| buddleia seedlings | |||
| ragwort | |||
| plantain | |||
| groundsel | |||
| willowherb | |||
| spurge | |||
| Totals |
Step 1: Calculate for each species (divide each species count by total )
Step 2: Square each value to get
Step 3: Sum all values:
Step 4: Subtract from :
Interpreting Simpson's index
The value ranges from to :
- near indicates low diversity (one or few species dominate)
- near indicates high diversity (many species with similar abundances)
The calculated value ( or ) represents the probability that two randomly selected individuals belong to different species. Higher values indicate more stable, resilient communities better able to withstand environmental pressures or pollution.
In the example above, the moderate value () reflects that while multiple species are present, daisies dominate the community ( out of individuals), reducing overall evenness.
Non-random sampling methods
While random sampling provides the most representative data, three non-random approaches are sometimes necessary when specific research questions or practical constraints make random sampling inappropriate.
Opportunistic sampling
Researchers sample locations based on convenience or accessibility rather than random selection. This method is quick but potentially biased — easily accessible areas may differ systematically from the whole habitat.
Opportunistic sampling is useful for preliminary surveys or when time and resources are extremely limited. However, results should be interpreted cautiously and never used to make population estimates or strong ecological conclusions about the entire habitat.
Stratified sampling
When a habitat contains distinct zones occupying different proportions of the total area, stratified sampling ensures fair representation. The proportion of samples taken from each zone matches its proportion of the total area.
For example, if woodland occupies of a study area and grassland , then of quadrats should be placed in woodland and in grassland.
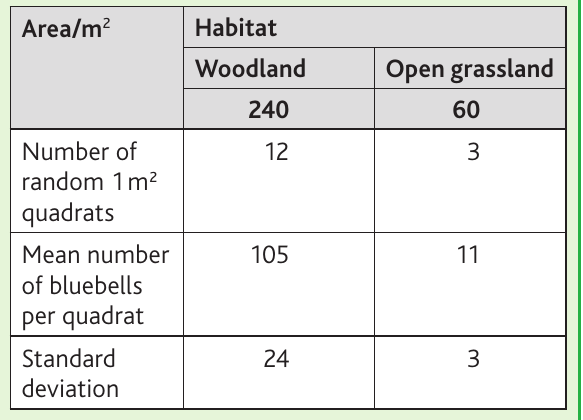
Worked Example: Stratified Sampling of Bluebells
The bluebell study demonstrates stratified sampling in practice:
- Woodland area: (sampled with quadrats)
- Open grassland: (sampled with quadrats)
- This maintains the area ratio, ensuring each habitat type is fairly represented
Within each zone, quadrat placement should still be random to avoid bias.
Systematic sampling using transects
Systematic sampling works best when investigating how species distribution changes across environmental gradients (e.g., from shore to inland, up a mountain, or across a field boundary).
A transect is a line placed across the habitat. Two types exist:
Line transects record which species touch the line at regular intervals (e.g., every ). This qualitative method quickly shows community changes but provides limited abundance data.
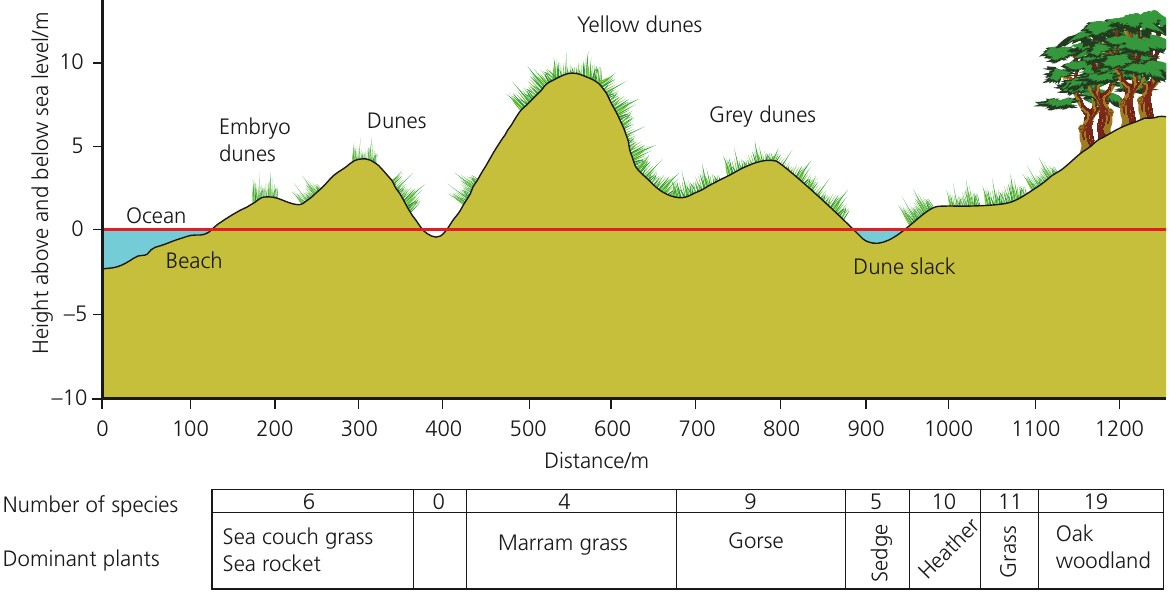
The sand dune transect illustrates how plant communities change with distance from the sea and elevation, showing increasing species richness from beach ( species) to woodland ( species). This pattern reflects changing environmental conditions — from harsh, salt-exposed conditions near the sea to more sheltered, stable conditions inland.
Belt transects provide quantitative data by placing quadrats along the transect line. Two approaches exist:
- Continuous belt transects: Quadrats placed end-to-end with no gaps (used for short distances)
- Interrupted belt transects: Quadrats placed at intervals (more practical for long distances)
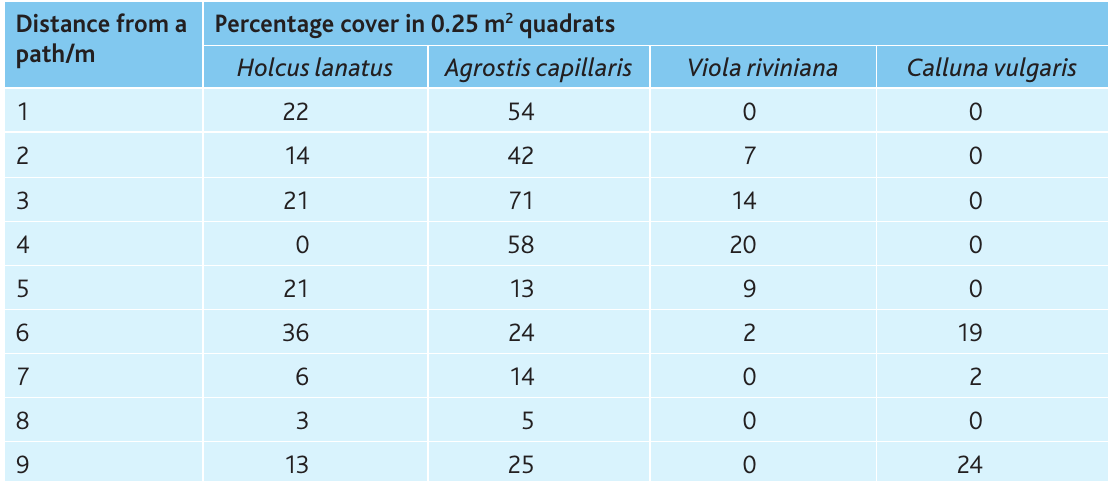
Results from belt transects are displayed as kite diagrams, which visually represent species abundance changes along the transect.
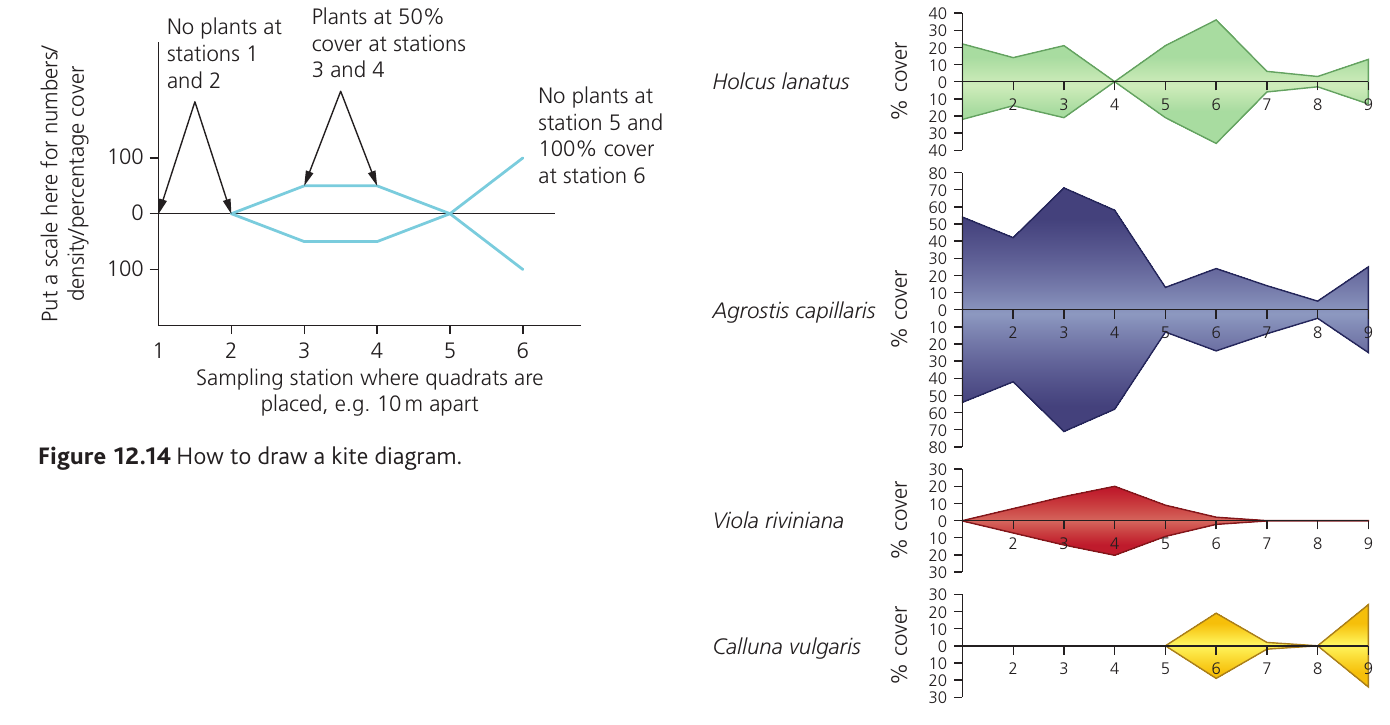
To construct a kite diagram:
- Draw a vertical scale for abundance (percentage cover, density, or count)
- Mark sampling stations along the horizontal axis
- Plot abundance values above and below a central line
- Connect the points to create a symmetrical "kite" shape for each species
The width of each kite at any station represents that species' abundance at that location, allowing quick visual comparison of distribution patterns.
ACFOR abundance scale
When species are too numerous to count accurately, the ACFOR scale provides semi-quantitative abundance data:
- Abundant
- Common
- Frequent
- Occasional
- Rare
Clear definitions must be established before using the ACFOR scale (e.g., "abundant = covers more than of quadrat area"). Without standardized definitions, different observers may classify the same species differently, making data comparison impossible.
Key Points to Remember:
-
Species richness counts different species; species evenness measures their relative abundances — both are needed to assess biodiversity fully
-
Quadrats enable three abundance measurements: frequency (percentage of quadrats containing species), density (individuals per unit area), and percentage cover (proportion of area occupied)
-
Random sampling uses random coordinates to prevent bias and ensure representative data — every part of the habitat must have equal chance of selection
-
The Lincoln index estimates mobile animal populations through mark-release-recapture:
-
Simpson's index () combines richness and evenness; values near 1 indicate high diversity, values near 0 indicate low diversity
-
Transects (line or belt) sample systematically along environmental gradients, with results displayed as kite diagrams showing distribution patterns along the gradient