Monohybrid Inheritance (OCR A-Level Biology A): Revision Notes
Monohybrid Inheritance
Introduction to genetic inheritance patterns
Genetic diagrams provide a visual method for tracking how genes and their alleles pass from parents to offspring across generations. These diagrams help predict the genotypes and phenotypes of offspring based on parental characteristics.
A monohybrid cross (also called a monogenic cross) examines the inheritance of a single gene with two alleles. The term "monohybrid" reflects that only one gene locus is being tracked through the cross. Understanding monohybrid inheritance forms the foundation for analyzing more complex inheritance patterns involving multiple genes.
Genetic diagrams serve as essential tools for visualizing inheritance patterns and making predictions about offspring characteristics. By following standardized notation rules, these diagrams allow geneticists worldwide to communicate complex inheritance patterns clearly and consistently.
Rules for constructing genetic diagrams
When drawing genetic diagrams, specific conventions ensure clarity and consistency. These standardized rules allow geneticists to communicate inheritance patterns effectively.
Always begin by stating the parental phenotypes, followed by their genotypes if known. This establishes what characteristics are being examined and the genetic basis for those traits.
Critical Notation Rules:
For genes with two alleles where one is dominant and one recessive, represent the gene with a single letter. Use upper case for the dominant allele and lower case for the recessive allele. Choose letters that are visually distinct (avoid using C and c, or S and s, which can be confused).
When a gene has multiple alleles in the population, use a single upper-case letter for the gene followed by superscript letters to distinguish the different alleles.
Codominant alleles are shown using the gene letter in upper case with codominant alleles indicated by superscript letters.
For example, in Drosophila melanogaster, wing length can be represented by W for the dominant normal (wild-type) long wing and w for the recessive vestigial (shortened) wing. The human ABO blood group system exemplifies multiple allele notation: I represents the gene, with alleles written as , , and . The A and B blood group alleles are both codominant and written as and respectively.
Complete dominance in monohybrid crosses
In classical Mendelian genetics, one allele completely masks the expression of another at the same locus. This pattern, called complete dominance, produces a characteristic 3:1 phenotypic ratio in the F₂ generation when two heterozygotes are crossed.
The wild type refers to the standard phenotype found naturally in a population. In genetic studies, the wild-type allele represents the "normal" version at a locus, contrasted with variant or mutant alleles. For example, in Drosophila, long wings represent the wild-type phenotype.
During meiosis, alleles at a gene locus separate because they occupy positions on different chromosomes of a homologous pair. This separation ensures each gamete receives only one allele from each gene. When a homozygous dominant individual (WW) is crossed with a homozygous recessive individual (ww), all F₁ offspring are heterozygous (Ww) and display the dominant phenotype.
Worked Example: Complete Dominance in Drosophila
Cross: Homozygous long wing (WW) × Homozygous vestigial wing (ww)
F₁ Generation: All offspring are Ww (heterozygous) showing long wings
F₁ × F₁ Cross: Ww × Ww
F₂ Generation Results:
- Genotypic ratio: 1 WW : 2 Ww : 1 ww
- Phenotypic ratio: 3 long wings : 1 vestigial wing
This 3:1 ratio is the hallmark of complete dominance.
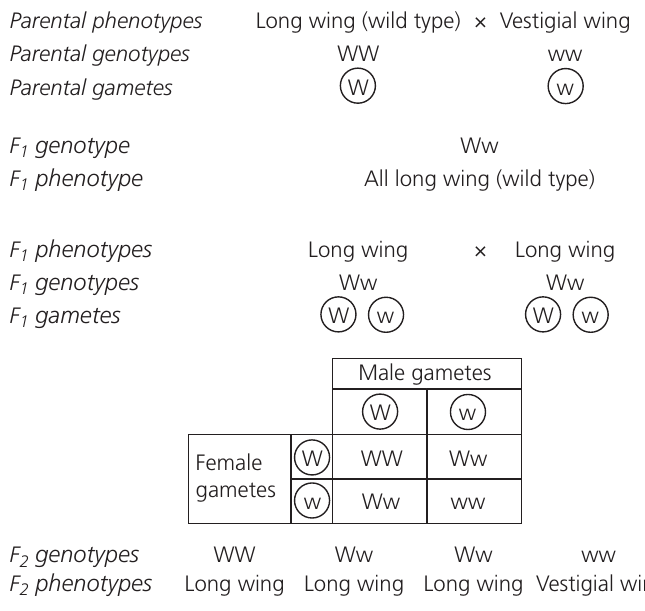
The diagram above illustrates a complete monohybrid cross tracking wing length in fruit flies. The F₁ generation all show the wild-type long wing phenotype despite being heterozygous. When F₁ flies mate, their offspring segregate in the expected 3:1 ratio.
Incomplete dominance
Incomplete dominance occurs when neither allele at a locus is dominant over the other. Instead of one allele masking another, the two alleles blend their effects, producing an intermediate phenotype in heterozygotes.
In snapdragon plants, flower colour demonstrates incomplete dominance. When a plant homozygous for red petals () is crossed with one homozygous for white petals (), all F₁ offspring are heterozygous () and display pink flowers. The superscript notation indicates that neither nor is dominant.
Crossing two pink-flowered plants produces an F₂ generation with a 1:2:1 ratio of red:pink:white flowers. This differs from complete dominance because the phenotypic ratio matches the genotypic ratio — heterozygotes are visually distinguishable from both homozygotes.
In incomplete dominance, the heterozygote phenotype is intermediate between the two homozygous phenotypes. This creates a situation where all three genotypes can be identified by their distinct appearances, resulting in phenotypic ratios that match genotypic ratios.
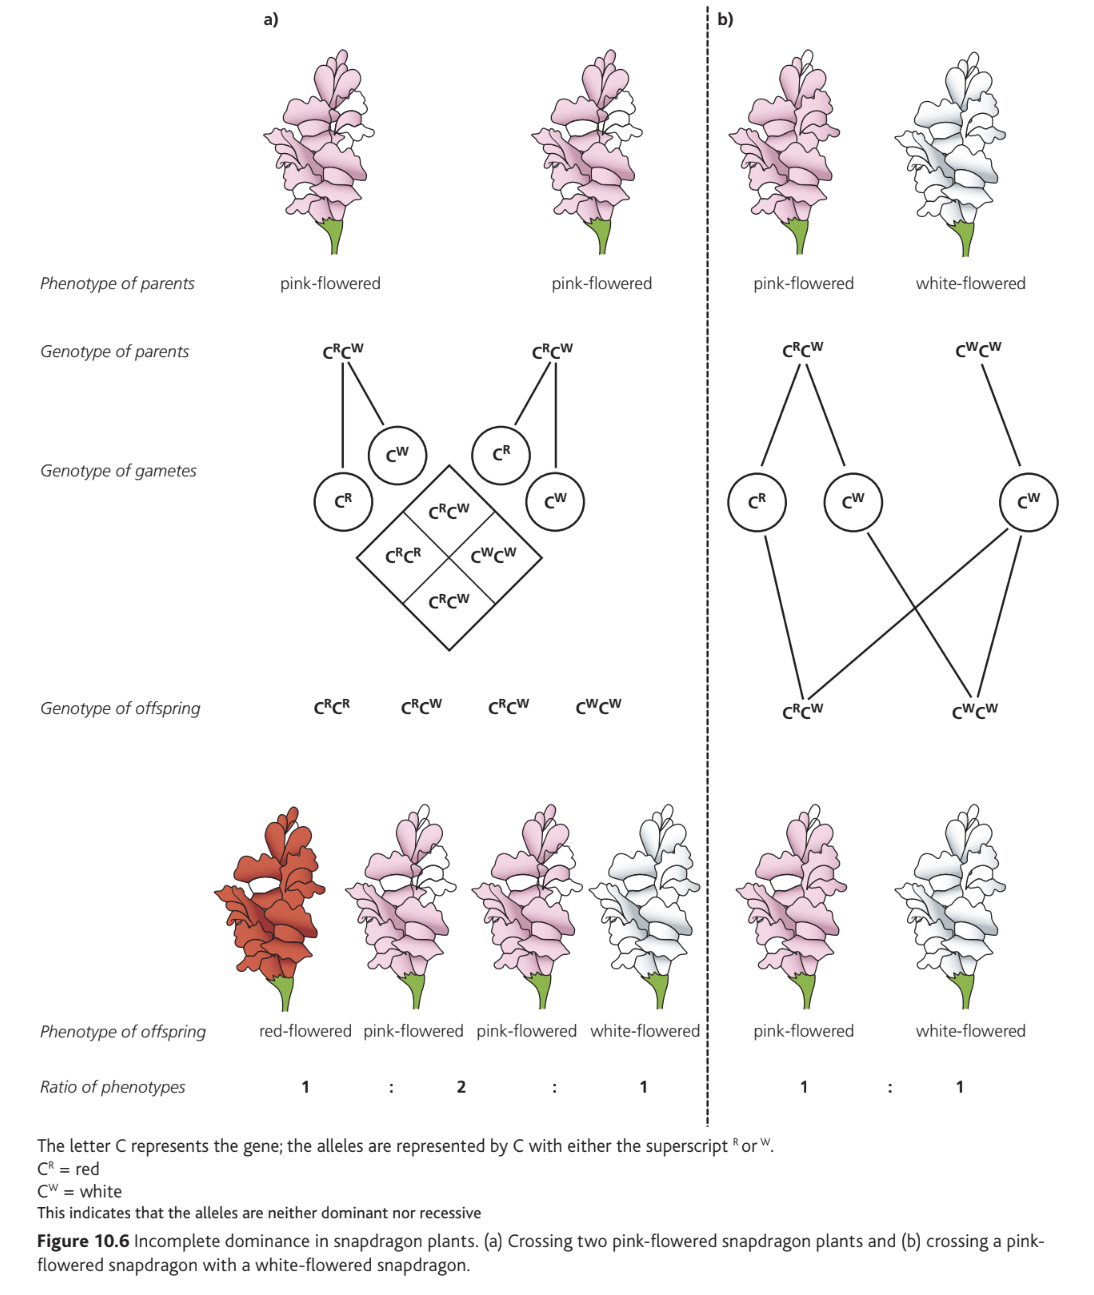
The figure above shows two crosses involving incomplete dominance. Panel (a) demonstrates a pink × pink cross yielding 1:2:1 offspring, while panel (b) shows a pink × white cross producing 1:1 pink and white offspring.
Codominance
Codominance describes a situation where two alleles at the same gene locus both influence the phenotype of a heterozygous organism. Neither allele is recessive — both are expressed fully and simultaneously. This differs from incomplete dominance, where alleles blend; in codominance, both characteristics appear distinctly.
Human ABO blood groups provide a well-studied example of codominance combined with multiple alleles. Coat colour in cattle represents another codominant system. Like incomplete dominance, codominant crosses produce a 1:2:1 phenotypic ratio in the F₂ generation, but the heterozygote displays features of both alleles rather than an intermediate form.
Key Distinction:
- Incomplete dominance: Alleles blend → intermediate phenotype (e.g., red + white = pink)
- Codominance: Both alleles fully expressed → both characteristics visible (e.g., both A and B antigens present)
Both patterns produce 1:2:1 phenotypic ratios, but for different reasons!
All examples of codominance represent discontinuous variation, where phenotypes fall into distinct categories rather than showing a continuous range.
Dihybrid inheritance and independent assortment
Dihybrid inheritance tracks two different characteristics simultaneously, each controlled by a separate gene. When these genes are located on different, non-homologous chromosomes, they are described as unlinked. Unlinked genes segregate independently during meiosis, allowing all possible combinations of alleles to form in gametes.
Consider a cross examining both body colour and wing type in Drosophila. Body colour has two alleles: E (dominant grey, wild-type) and e (recessive ebony/black). Wing shape also has two alleles: N (dominant normal, wild-type) and n (recessive curly). When pure-breeding flies with grey bodies and normal wings (EENN) are crossed with flies having ebony bodies and curly wings (eenn), all F₁ offspring are heterozygous for both genes (EeNn) and show both wild-type phenotypes.
Worked Example: Dihybrid Cross in Drosophila
P Generation: Grey body, normal wings (EENN) × Ebony body, curly wings (eenn)
F₁ Generation: All EeNn (grey body, normal wings)
F₁ × F₁ Cross: EeNn × EeNn
F₂ Generation Results (approximate):
- 650 grey body, normal wings
- 198 grey body, curly wings
- 225 ebony body, normal wings
- 68 ebony body, curly wings
Ratio: Approximately 9:3:3:1
This is the hallmark ratio of independent assortment!
Crossing two F₁ individuals produces an F₂ generation with the characteristic 9:3:3:1 ratio. Examining each trait separately reveals a 3:1 ratio for body colour and 3:1 for wing type, confirming the genes assort independently.
A Punnett square for this cross shows nine different genotypes but only four phenotypes due to dominance. The explanation for these results lies in independent assortment — the principle that genes on different chromosomes separate randomly during meiosis I, producing all possible allele combinations in gametes with equal probability.
Gene linkage and crossing over
Linkage describes genes located on the same autosomal chromosome (an autosome is any chromosome other than a sex chromosome). Linked genes do not follow independent assortment because they are physically connected on the same DNA molecule. This connection disturbs the expected phenotypic ratios and reduces genetic variation in offspring.
A test cross determines the genotype of an individual by crossing it with a homozygous recessive individual. For two unlinked genes, a test cross between a double heterozygote and a double homozygous recessive produces a 1:1:1:1 ratio of phenotypes. However, linked genes produce a 1:1 ratio if they remain together throughout meiosis.
Types of Linkage:
Complete linkage occurs when genes are so close together on a chromosome that they always segregate together, with no recombination between them. The gametes produced contain only parental combinations of alleles, never new combinations.
Partial linkage describes genes that are separated by some distance along a chromosome. Crossing over during meiosis can occur between these loci, breaking the linkage and producing recombinant gametes.
The frequency of recombination reflects the distance between genes — the farther apart two genes are, the more likely crossing over will occur between them.
| Cross | Genotypes and ratios | Explanation |
|---|---|---|
| 1 | ABab (52) : abab (48) | Complete linkage with no crossing over between genes |
| 2 | ABab (46) : Abab (5) : aBab (6) : abab (43) | Partial linkage; genes positioned close together on chromosome |
| 3 | ABab (34) : Abab (12) : aBab (16) : abab (38) | Partial linkage; genes more distant than in cross 2 |
| 4 | AaBb (24) : Aabb (26) : aaBb (29) : aabb (21) | Unlinked genes showing independent assortment (approximately 1:1:1:1) |
The table above compares test cross results for linked versus unlinked genes. Notice how the recombinant classes (Abab and aBab) increase in frequency as the distance between genes increases, until genes are far enough apart (or on different chromosomes) to assort independently.
Sex linkage
Sex linkage refers to genes present on the X chromosome. This inheritance pattern has nothing to do with determining biological sex itself. The X chromosome carries hundreds of genes coding for many important characteristics beyond sex determination. In contrast, the Y chromosome contains relatively few genes, primarily those involved in male sexual development.
Hemizygosity in Males:
Males in species like humans and Drosophila have one X and one Y chromosome (XY). This makes them hemizygous for X-linked genes — they possess only one allele for each X-linked characteristic, which will always be expressed regardless of whether it would typically be dominant or recessive in females.
A recessive allele on a male's single X chromosome produces the recessive phenotype because no second allele is present to mask it.
Females possess two X chromosomes (XX), carrying two alleles for each sex-linked gene. For a recessive X-linked trait to appear in females, both X chromosomes must carry the recessive allele. When females have one recessive and one dominant allele, they are carriers — they display the dominant phenotype but can pass the recessive allele to offspring.
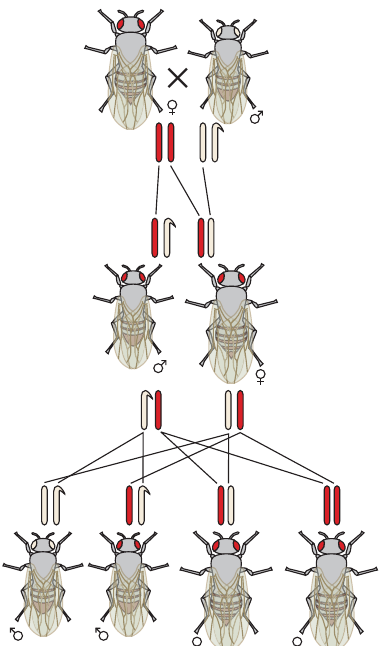
The diagram illustrates sex-linked inheritance in Drosophila melanogaster. Eye colour in fruit flies demonstrates sex linkage, with red eyes () dominant over white eyes ().
| Males | Females | ||
|---|---|---|---|
| Genotype | Phenotype | Genotype | Phenotype |
| Red eyes | Red eyes | ||
| White eyes | Red eyes (carrier) | ||
| White eyes |
Notice that males need only one copy of the recessive allele to display white eyes, while females require two copies. Carrier females () appear red-eyed but can produce both red- and white-eyed sons.
Multiple alleles
Many genes exist in more than two allelic forms within a population, a phenomenon called multiple allelism. Although numerous alleles may exist across a population, any diploid individual can only carry two alleles (one from each parent).
The human ABO blood group system exemplifies multiple alleles. Three alleles exist at this locus on chromosome 9: , , and . These alleles control production of antigens (specific proteins) on red blood cell surfaces.
| Blood group | Possible genotypes |
|---|---|
| A | or |
| B | or |
| AB | |
| O |
The alleles and are both dominant over . Therefore, individuals with genotypes display blood group A, while individuals show blood group B. However, and are codominant to each other — when present together in genotype , both A and B antigens appear on red blood cells, producing blood group AB.
ABO Blood Groups and Immune Response:
These surface proteins are termed "antigens" because when red cells from one person are introduced into an incompatible recipient, the immune system recognizes them as foreign and produces antibodies. Blood typing before transfusions or transplants ensures donor and recipient compatibility, preventing potentially fatal immune responses.
Epistasis
Epistasis occurs when two or more genes interact to influence a single phenotypic characteristic. Although these genes may segregate independently during meiosis (if on different chromosomes), their interactions modify the expected phenotypic ratios. One gene effectively suppresses or masks the expression of another gene.
Epistatic interactions frequently involve metabolic pathways where each gene codes for a different enzyme. If an individual is homozygous recessive for a gene coding a particular enzyme, that enzyme is non-functional. This stops the metabolic pathway at that step, preventing the characteristic from being expressed even if dominant alleles exist at other loci in the pathway.
How Epistasis Blocks Pathways:
When an individual is homozygous recessive (aa or bb), no functional enzyme is produced, blocking that step in the pathway. This prevents the final product from being made, regardless of what alleles are present at other gene loci.
This is why epistasis creates modified phenotypic ratios instead of the standard 9:3:3:1 ratio expected from dihybrid crosses.
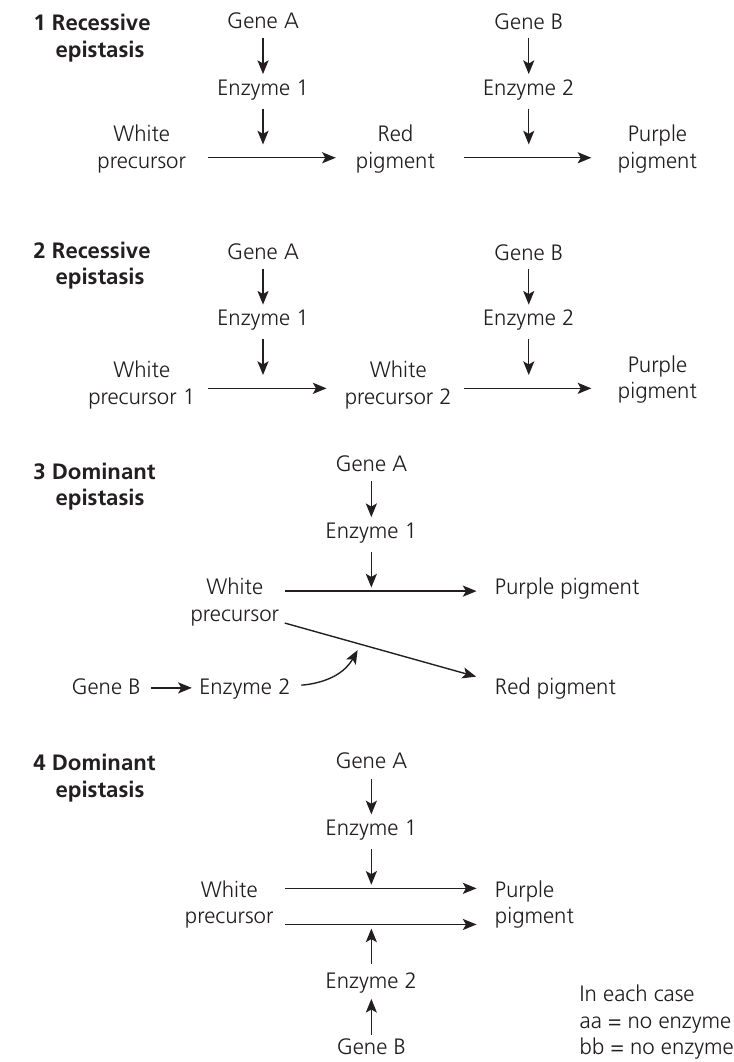
The figure above illustrates four different epistatic interactions involving enzyme pathways for pigment production. In each pathway, genes A and B code for enzymes that convert substrates in a sequence. When an individual is homozygous recessive (aa or bb), no functional enzyme is produced, blocking that step in the pathway.
Different types of epistasis produce characteristic F₂ ratios when dihybrid heterozygotes are crossed:
| Type of epistasis | F₂ phenotypic ratios | Example explanation | |||
|---|---|---|---|---|---|
| No epistasis (independent assortment) | 9 | 3 | 3 | 1 | Standard dihybrid ratio |
| Recessive epistasis (Example 1) | 9 purple | 3 red | 4 white | Both dominant alleles (A and B) needed for purple; A_bb produces red; aa blocks all pigment | |
| Recessive epistasis (Example 2) | 9 purple | 7 white | Both dominant alleles required for any pigment production | ||
| Dominant epistasis (Example 3) | 12 purple | 3 red | 1 white | Dominant allele A produces purple regardless of B; only aaBb produces red | |
| Dominant epistasis (Example 4) | 15 purple | 1 white | Either dominant allele (A or B) produces purple pigment |
Worked Example: Recessive Epistasis (Example 1)
In this pathway, both enzymes are required for complete pigment production:
- Enzyme 1 (gene A) converts white precursor → intermediate compound
- Enzyme 2 (gene B) converts intermediate compound → purple pigment
Genotype A_B_: Both enzymes functional → purple pigment (9 individuals)
Genotype A_bb: Enzyme 1 works but enzyme 2 doesn't → intermediate compound accumulates as red pigment (3 individuals)
Genotype aaB_ or aabb: Enzyme 1 non-functional → pathway blocked at first step → white (no pigment) (4 individuals total)
Final ratio: 9 purple : 3 red : 4 white
Using chi-squared analysis
The chi-squared () statistical test evaluates whether observed data differ significantly from expected values. In genetics, this test determines if experimental results match theoretical predictions based on inheritance patterns.
The test compares observed offspring numbers in each category against expected numbers predicted by a hypothesis (the null hypothesis). The null hypothesis typically states that genes assort independently or follow a particular inheritance pattern.
The chi-squared value is calculated using:
where:
- means "sum of"
- represents observed values from the experiment
- represents expected values from the hypothesis
Interpreting Chi-Squared Results:
After calculating , this value is compared to critical values in a probability table. Biologists typically use the 5% (or 0.05) significance level. The degrees of freedom (df) equal , where is the number of categories.
If calculated < critical value at : → Accept the null hypothesis — the difference between observed and expected results can be attributed to random chance.
If calculated > critical value: → Reject the null hypothesis — the results differ significantly from expectations, suggesting linkage or other factors are influencing inheritance.
Remember!
Key Points to Remember:
-
Monohybrid crosses track single genes through generations, producing characteristic ratios: 3:1 for complete dominance, 1:2:1 for incomplete dominance or codominance.
-
Dihybrid crosses of unlinked genes produce 9:3:3:1 ratios in F₂ generations due to independent assortment, while linked genes show modified ratios depending on crossing-over frequency.
-
Sex-linked traits on the X chromosome affect males more frequently because they are hemizygous — one recessive allele produces the recessive phenotype. Females can be carriers without expressing recessive X-linked traits.
-
Multiple alleles exist for many genes in populations (like ABO blood groups with three alleles), though individuals carry only two alleles. Some alleles show codominance while others show dominance relationships.
-
Epistasis occurs when genes interact to influence the same characteristic, modifying expected ratios. Understanding enzyme pathways helps predict which genotypes will produce which phenotypes in epistatic interactions.