Interactions Between Populations (OCR A-Level Biology A): Revision Notes
Interactions Between Populations
Interspecific competition
Interspecific competition occurs when individuals of different species compete for the same limited resources within an ecosystem. This type of competition can have significant impacts on population distribution, abundance, and evolutionary development of the species involved.
Interspecific competition shapes ecosystems by influencing which species can coexist in the same area and how resources are distributed among different organisms. Understanding these interactions is crucial for conservation efforts and managing biodiversity.
Competition between bluebell species
The English bluebell (Hyacinthoides non-scripta) faces a conservation threat from the Spanish bluebell (Hyacinthoides hispanica), which was introduced to UK gardens during the seventeenth century. Since 1909, Spanish bluebells have spread into woodland habitats across the UK, where they compete directly with the native species.
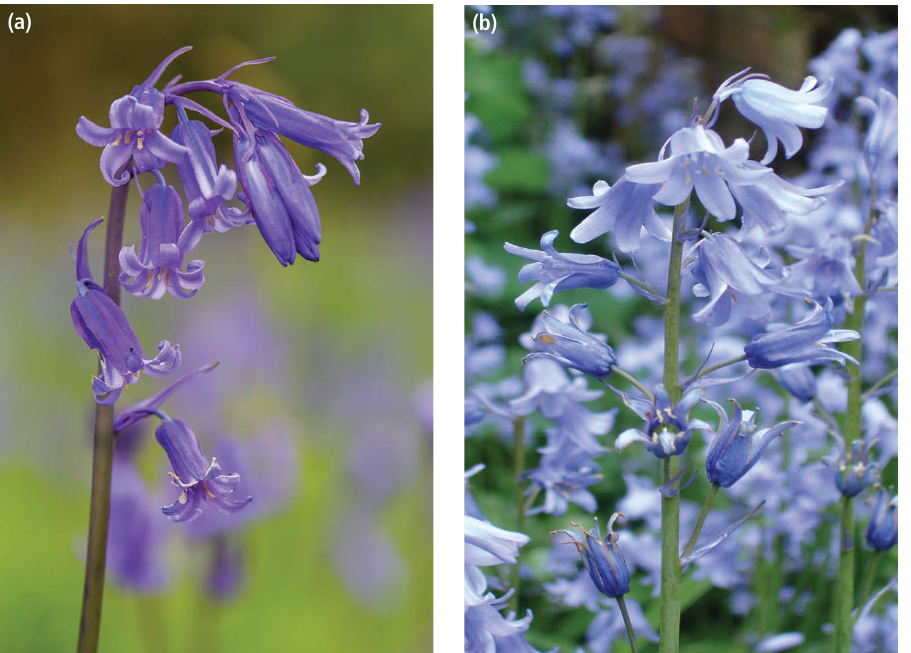
Both the Spanish bluebell and hybrids between the two species grow more vigorously than English bluebells. They produce highly fertile seeds that enable rapid colonisation of bluebell woodlands. Research from 2013 indicates that both invasive types flower earlier than English bluebells, potentially giving them a competitive advantage when establishing in new areas. The UK is home to approximately 50% of the world's population of H. non-scripta, making conservation of natural woodland populations particularly important.
The English bluebell is a species of significant conservation concern. With the UK hosting half of the global population, protecting native woodland populations from competition with Spanish bluebells and their hybrids is critical for the species' survival.
Experimental evidence: Barnacle competition
Field experiments on rocky shores have provided clear evidence of interspecific competition. Chthamalus stellatus and Balanus balanoides are two barnacle species that inhabit rocky shore environments. While larvae of C. stellatus settle across the shore, adult barnacles only develop in certain zones, suggesting competition with B. balanoides.
Researchers designed an experiment using wire cages to exclude predators from rocks where adult C. stellatus were normally absent. In some caged areas, all B. balanoides individuals were removed, while in others they remained. Adult C. stellatus populations were monitored over two years.
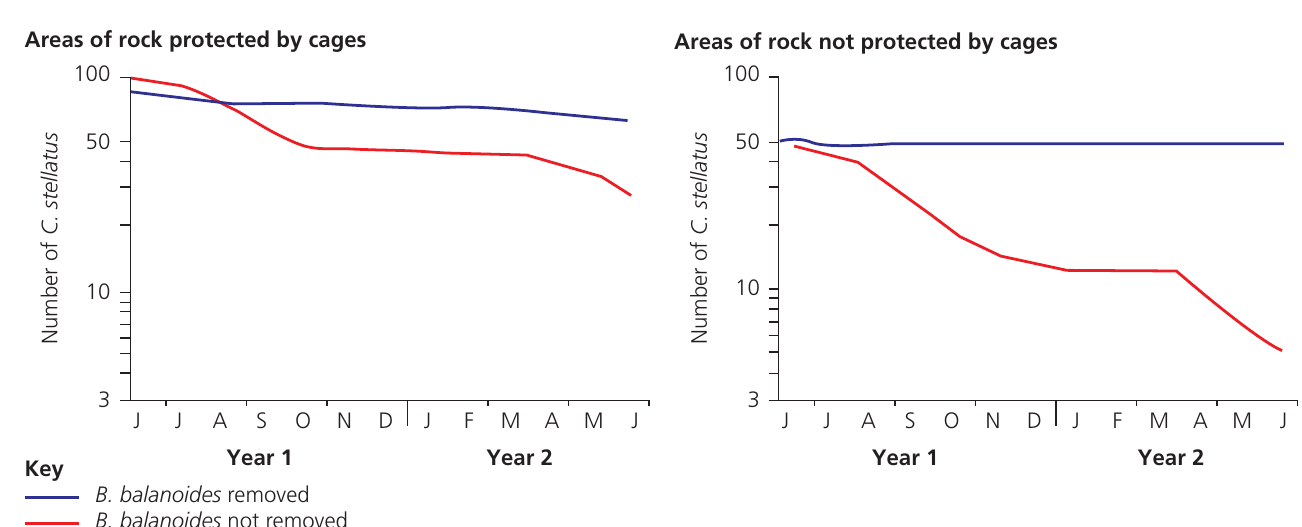
Experimental Results: Barnacle Competition Study
The results demonstrate that C. stellatus numbers declined even in predator-free environments where B. balanoides remained present. The decline was more severe in uncaged areas.
Key Observation: Direct observation revealed that Balanus either grew over Chthamalus, smothering it, or grew beneath it, lifting it from the rock surface.
Conclusion: This physical interference represents a form of interspecific competition, demonstrating that predation was not the primary limiting factor for C. stellatus distribution.
Competitive exclusion
When two species have very similar requirements for their niche (the role of a species in a habitat, including its trophic level, interactions with the abiotic environment, and interactions with other species), the competition between them becomes intense. This does not necessarily involve direct fighting; instead, competition can be subtle, with the less successful species experiencing starvation or inability to reproduce.
Competitive exclusion is the principle stating that when individuals of different species compete for the same resources, one species may succeed while the other becomes excluded from the niche and completely disappears. This means each niche in an ecosystem is typically occupied by only one species, with competing species being excluded.
Competitive Exclusion Principle: When two species compete for identical resources in the same niche, one will inevitably outcompete the other. The less competitive species will either:
- Adapt to occupy a different niche
- Migrate to a different area
- Face local extinction
This principle explains why species with very similar ecological roles rarely coexist in stable populations within the same habitat.
Resource partitioning
Species can coexist in the same ecosystem by avoiding direct competition through resource partitioning. This occurs when different species competing for similar resources occupy slightly different niches.
A clear example comes from anolis lizards in the Dominican Republic. Seven different species feed on the same prey animals (insects and small arthropods) but avoid direct competition by perching at different heights and locations to catch their food. Each species has evolved to prefer specific perching sites within the forest structure.
Resource Partitioning in African Savannas
Zebra and wildebeest demonstrate effective resource partitioning among grazers:
- Zebra graze the harder, tougher parts of grasses
- Wildebeest prefer softer new growth
- Zebra typically move into areas of long grass first, eating it down and exposing new growth suitable for wildebeest
This sequential grazing pattern allows both species to coexist without intense competition.
In tropical forests, grazers have evolved to feed at different heights, with some specialising on fruits and others on leaves.
Character displacement
Character displacement occurs when two species that compete with each other show differences in physical features where they coexist, but do not show these differences where they exist separately. This represents an evolutionary response to reduce competition.
The marine snails Hydrobia ulvae and Hydrobia ventrosa inhabit mud flat environments. When populations of these species live in separate habitats (allopatry), their shells are similar in size. However, where both species occupy the same habitat (sympatry), H. ulvae consistently develops larger shells. This size difference reduces direct competition for resources between the species.
Character displacement is powerful evidence of evolution in action. It demonstrates how species can evolve different characteristics specifically in areas where they overlap, reducing competition and allowing coexistence. This evolutionary adaptation occurs over many generations in response to competitive pressure.
Predator-prey relationships
Predator-prey interactions create dynamic population changes in ecosystems. When populations of primary consumers increase, such as aphids, they provide abundant food for their predators, in this case ladybird beetles.
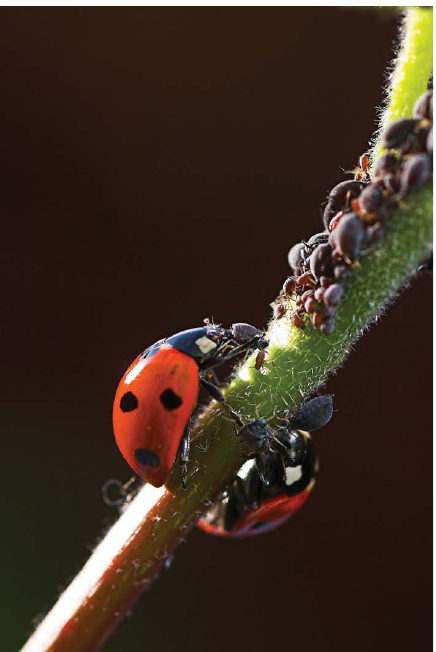
Predator numbers typically increase following an increase in food supply. As predator populations grow, predation intensity increases, leading to a decrease in prey numbers. With fewer prey available, predator populations subsequently decline due to reduced food availability.
The lynx and snowshoe hare cycle
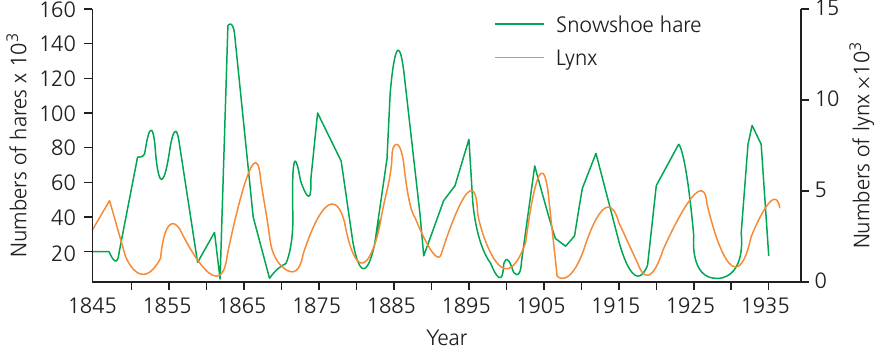
The classic example of predator-prey population cycles comes from Canada's Arctic regions, where lynx (predator) and snowshoe hares (prey) were extensively trapped for the fur trade during the nineteenth and early twentieth centuries. Data from various sources, including Hudson's Bay Company trapping records, revealed that both species' populations fluctuated with peaks occurring approximately every 10 years across different Canadian regions.
Characteristic Features of Predator-Prey Cycles:
The graph shows key patterns that are typical of predator-prey relationships:
- Population numbers of both species fluctuate at fairly regular intervals
- Peaks and troughs in the predator cycle lag slightly behind those of the prey
- These patterns demonstrate the interconnected nature of predator and prey populations
Understanding population fluctuations
The predator-prey cycle can be interpreted through the following sequence:
- The prey population increases when few limiting factors are present
- More food becomes available to predators, whose numbers increase after a lag period needed for reproduction
- Increased predator populations lead to more prey being consumed
- Intensified predation limits the prey population, whose numbers begin falling while predator numbers continue rising
- Fewer prey animals reduce food availability for predators, whose numbers fall through reduced reproduction and starvation
- The cycle repeats
Bottom-Up vs. Top-Down Control
Research has shown that decreases in prey populations often result more from increased intraspecific competition for food and starvation rather than solely from predation.
- "Bottom-up" control = Food supply limiting population growth
- "Top-down" control = Predation limiting population growth
Food supply represents a "bottom-up" control mechanism, often more important than "top-down" predation effects in limiting prey population growth.
Complexity in natural ecosystems
The lynx-snowshoe hare example represents a simplified ecosystem with one prey species and one main predator. Most natural ecosystems contain more complex feeding relationships where:
- Each predator species feeds on several prey species
- Each prey species faces predation from multiple predator species
- When one prey species declines, predators can switch to alternative food sources
- The dominant predator consuming any particular prey species may change over time
This complexity dampens the regular cycling patterns seen in simple predator-prey systems. In diverse ecosystems, the clear oscillations observed in the lynx-hare system become less pronounced because predators have multiple food sources and prey face pressure from multiple predators.
Selective predation
Predators often show size preferences when hunting prey. Research on shore crabs feeding on mussels demonstrates this selective behaviour. When offered mussels of different sizes, crabs showed preferences for particular size ranges:
| Mussel groups offered | Mean smaller-size group consumed | Mean larger-size group consumed | Statistical significance |
|---|---|---|---|
| Groups 1 and 3 (15-20mm vs 26-30mm) | 47 | 27 | p < 0.05 (significant) |
| Groups 2 and 3 (21-25mm vs 26-30mm) | 66 | 48 | NS (not significant) |
| Groups 3 and 4 (26-30mm vs 31-35mm) | 35 | 29 | NS |
| Groups 3 and 5 (26-30mm vs 36-40mm) | 47 | 7 | p < 0.05 (significant) |
These results indicate crabs prefer intermediate-sized mussels, avoiding the largest size class. This likely reflects the energy cost of breaking open larger shells versus the energy gained from consuming them.
Understanding Optimal Foraging
Selective predation demonstrates that predators make "decisions" based on energy economics:
- Very small prey may not provide enough energy to justify the effort of capture
- Very large prey may require too much energy to handle or consume
- Intermediate-sized prey often represent the optimal balance between energy cost and energy gain
Studies on gull predation of crabs reveal different patterns:
| Crab species | Mean carapace width of living crabs (mm) | Mean carapace width predated by gulls (mm) |
|---|---|---|
| A | ||
| B | ||
| C | ||
| D |
Species B shows gulls selecting smaller individuals from the population, possibly because larger crabs are more difficult to handle or transport. Gulls often carry crabs away from where they catch them, which may influence size selection.
Case study: Owl and vole populations
Case Study: Long-Term Predator-Prey Study in a Forest Ecosystem
A long-term forest ecosystem study examined the relationship between owl (predator) and vole (prey) populations over a 10-year period. Researchers counted owls directly and used Longworth traps to estimate vole populations in a sample area.
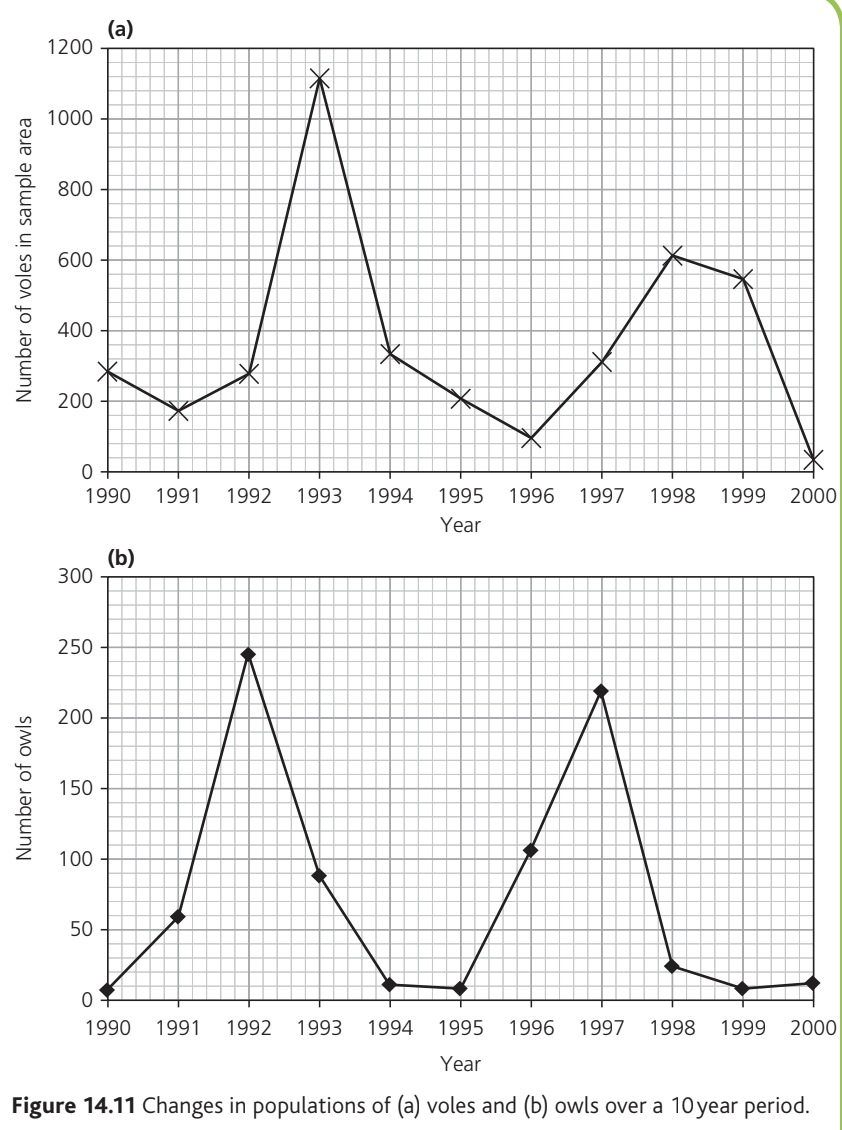
Vole Population Patterns:
- Population fluctuated considerably
- Peaks: approximately 1120 in 1993 and 620 in 1998
- Troughs: below 100 in 1996 and below 50 in 2000
- Between 1990 and 1992: populations remained between 180 and 300
Owl Population Patterns:
- Peaks: around 245 individuals in 1992 and 220 in 1997
- Unexpected finding: The owl population increased before vole numbers rose in 1992-1993 and 1996-1998
- Owl numbers decreased while vole populations were increasing
Interpretation:
These patterns indicate that vole population size is not the only factor controlling owl numbers, contrary to simple predator-prey models.
Other factors influencing vole populations might include:
- Food scarcity leading to starvation
- Competition from other herbivores (e.g., mice)
- Predation by other predators (e.g., weasels)
- Weather changes affecting plant growth and seed production
- Disease outbreaks
- Migration away from the study area
Similarly, owl populations are affected by availability of other prey species (mice, shrews) and factors causing mortality or migration beyond vole abundance.
This case study illustrates the complexity of real ecosystems. Unlike theoretical models with single predator-prey pairs, natural populations are influenced by:
- Multiple food sources for predators
- Multiple predators for prey
- Environmental factors (weather, disease, habitat changes)
- Competition with other species
- Migration patterns
These factors explain why real population cycles rarely match the simple, regular patterns predicted by basic predator-prey models.
Remember!
Key Points to Remember:
-
Interspecific competition occurs when different species compete for the same resources, potentially leading to competitive exclusion where one species dominates and the other disappears from the niche
-
Species can coexist through resource partitioning (occupying slightly different niches) or character displacement (evolving different physical features where they overlap)
-
Predator-prey cycles show linked population fluctuations, with predator peaks lagging behind prey peaks, though real ecosystems are more complex with multiple predators and prey
-
Prey population control is often "bottom-up" through food supply and intraspecific competition rather than solely "top-down" through predation
-
Predators often show selective predation based on prey size, balancing energy costs of capture against energy gained from consumption