Economic policy objectives (OCR A-Level Economics): Revision Notes
2.8 The Phillips Curve
DEFINITIONS:
- NAIRU: The Non-Accelerating Inflation Rate of Unemployment (NAIRU) is the level of unemployment at which inflation remains stable, neither accelerating nor decelerating.
Explain:
2.8.1 Natural rate of unemployment; non-accelerating inflation rate of unemployment (NAIRU)
Natural Rate of Unemployment: The natural rate of unemployment refers to the level of unemployment that persists in an economy when it is operating at full potential or potential output. It includes frictional and structural unemployment but excludes cyclical unemployment, which varies with the business cycle. It represents the equilibrium level of unemployment that exists even when the economy is producing at its maximum sustainable output.
Non-Accelerating Inflation Rate of Unemployment (NAIRU): The NAIRU is the level of unemployment below which inflation begins to accelerate. It indicates the lowest sustainable rate of unemployment that an economy can achieve without causing inflation to increase. Economists believe that when unemployment falls below the NAIRU, resource utilisation increases to a point where wages and prices start to rise more rapidly, leading to inflationary pressures. Thus, the NAIRU serves as a guide for policymakers in balancing low unemployment with stable prices.
Explanation with the aid of a diagram
2.8.2 Keynesian and Neo-Classical Approaches to Aggregate Supply
Keynesian Approach: The Keynesian view of aggregate supply (AS) is characterised by the belief that the economy can be in equilibrium at less than full employment. According to Keynesian economics, the AS curve is divided into three distinct regions:
- Horizontal (or flat) portion at low levels of output: At this stage, there are idle resources and unemployment, so increases in aggregate demand (AD) do not lead to higher prices but result in higher output and employment.
- Upward-sloping portion: As the economy approaches full employment, some resources become scarce, leading to increased costs and higher prices as output increases.
- Vertical portion at full employment: When the economy reaches full employment, any increase in AD only leads to higher prices (inflation) with no increase in output.
Diagram:
Neo-Classical Approach: The neo-classical view of aggregate supply assumes that the economy is always at or rapidly returns to full employment due to flexible prices and wages. The AS curve in the neo-classical model is vertical at the full employment level of output (potential output), indicating that in the long run, output is determined by factors such as technology, resources, and institutional factors, rather than the price level.
Diagram:
Key Differences:
- Shape of AS Curve:
- Keynesian: AS curve has a flat portion at low levels of output, becomes upward-sloping as output increases, and vertical at full employment.
- Neo-Classical: AS curve is vertical at the full employment level of output, indicating no relationship between the price level and real GDP in the long run.
- Price and Output Relationship:
- Keynesian: Suggests that in the short run, the economy can be below full employment, and increases in AD can lead to higher output without inflation until the full employment level is reached.
- Neo-Classical: Assumes the economy operates at full employment in the long run, and increases in AD only lead to higher prices without affecting output.
- Policy Implications:
- Keynesian: Advocates for active government intervention to manage demand, especially during recessions, to boost output and reduce unemployment.
- Neo-Classical: Emphasises the importance of supply-side policies to improve efficiency and productivity, with limited need for demand management policies.
2.8.3 Short-run and Long-run Phillips Curve
Explanation:
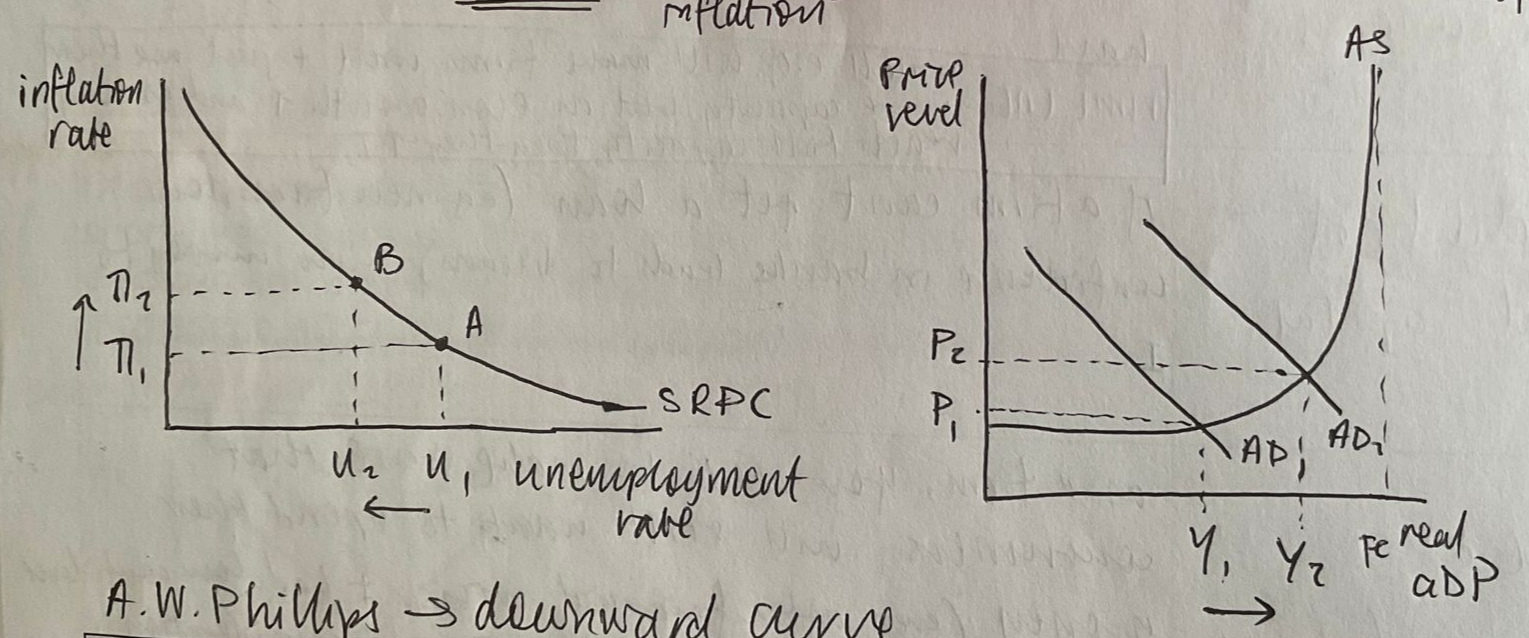
The Phillips Curve illustrates the relationship between inflation and unemployment. In the short run, there is typically an inverse relationship, meaning higher inflation is associated with lower unemployment, and vice versa. However, in the long run, this relationship breaks down, and the economy returns to the natural rate of unemployment, regardless of inflation.
Short-run Phillips Curve (SRPC):
- Inverse Relationship: In the short run, as aggregate demand increases, unemployment falls, and inflation rises.
- Adaptive Expectations: Workers and firms adjust their expectations based on past inflation, leading to short-term trade-offs between inflation and unemployment.
Long-run Phillips Curve (LRPC):
- Vertical at Natural Rate of Unemployment: In the long run, the economy adjusts to changes in inflation expectations, and unemployment returns to its natural rate.
- No Trade-off: There is no long-term trade-off between inflation and unemployment. The long-run Phillips Curve is vertical, indicating that the natural rate of unemployment is independent of the inflation rate.
Diagram:
Below is a diagram illustrating both the short-run and long-run Phillips Curves:
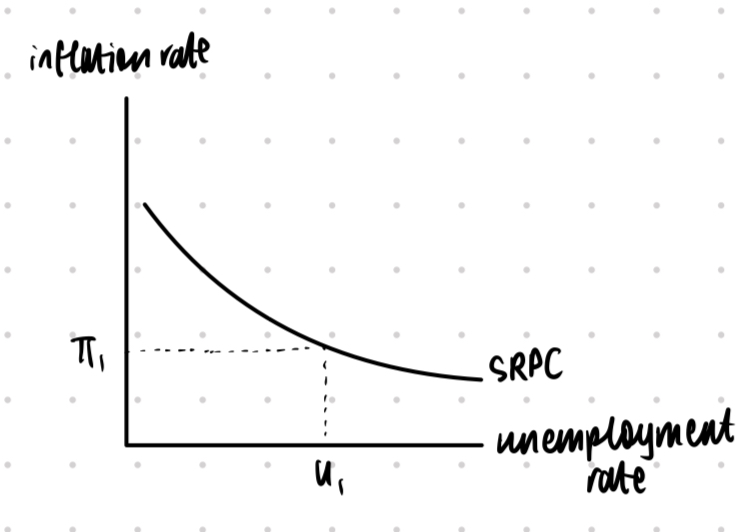
Short-Run Phillips Curve
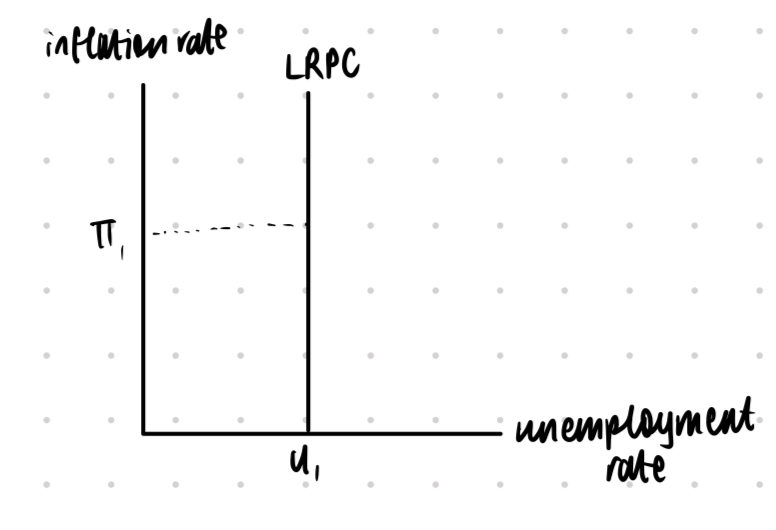
Long-Run Phillips Curve
Key Points in the Diagram:
- SRPC1: The downward-sloping short-run Phillips Curve shows the inverse relationship between inflation and unemployment in the short run.
- LRPC: The vertical long-run Phillips Curve at the Natural Rate of Unemployment (NRU) shows that in the long run, unemployment is determined by structural factors and is unaffected by inflation.
- Natural Rate of Unemployment (NRU): This is the rate of unemployment where the economy is at full employment, considering factors like frictional and structural unemployment.
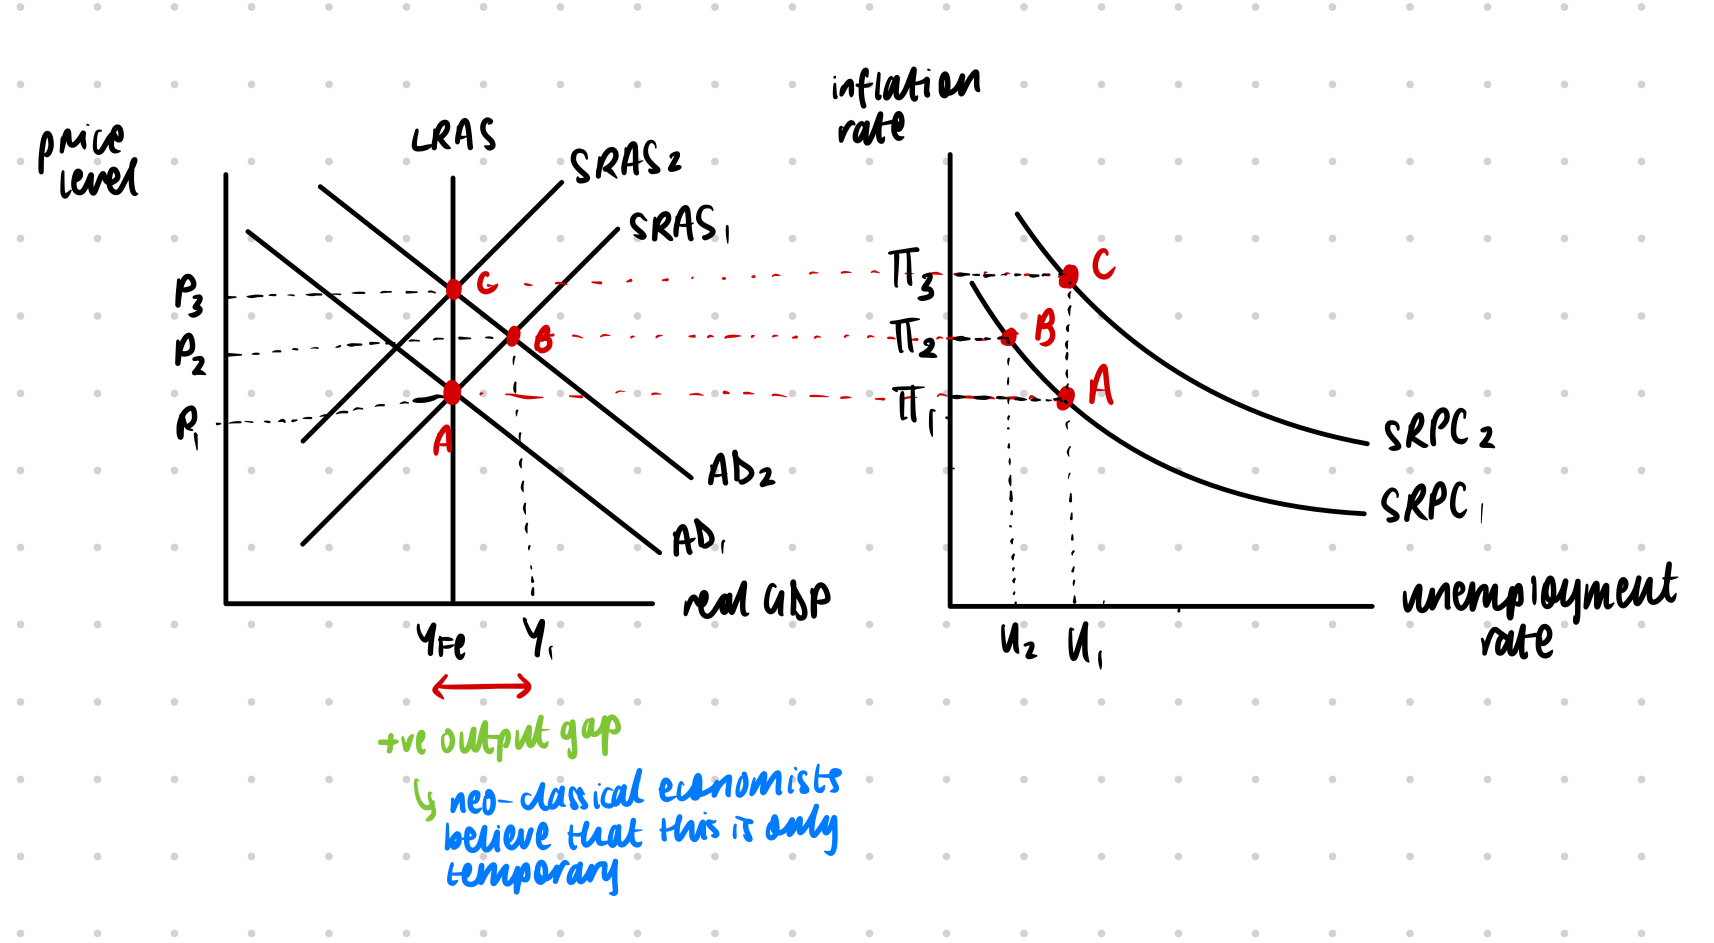
Explanation in Context:
- Short-Run Dynamics: If the government uses expansionary policies to reduce unemployment below the natural rate, inflation rises. However, as workers and firms adjust their expectations to higher inflation, the SRPC shifts upward, leading to higher inflation without reducing unemployment in the long run.
- Long-Run Adjustment: In the long run, attempts to reduce unemployment below the natural rate only result in higher inflation. The economy adjusts back to the natural rate of unemployment, represented by the vertical LRPC, illustrating that unemployment is not influenced by inflation in the long term.