Financial terms and calculations (AQA GCSE Business): Revision Notes
Financial terms and calculations
Introduction
Understanding financial performance is crucial for every business owner and entrepreneur. You need to grasp key financial concepts and be able to interpret financial data effectively. This knowledge helps businesses make informed decisions about investments, pricing, and overall strategy. The ability to perform financial calculations allows you to measure the success of potential investment opportunities and understand whether your business is profitable.
Understanding business costs
Financial terms can be organised into revenue and costs, which together help determine whether a business is making a profit or loss. Let's start by exploring the different types of costs that businesses face.
What are costs?
Costs represent the money that businesses must spend to produce goods and deliver services. While every business has costs, these vary significantly depending on the type of business and the scale of operations. For new businesses, estimating likely costs can be particularly challenging.
Successful businesses pay close attention to their costs because they want to keep them as low as possible. This focus on cost control is important for several reasons:
Why Cost Control Matters:
- Higher costs reduce the potential profits a business can achieve
- Costs are often the primary cause of cash flow difficulties in small businesses
- Costs fluctuate as business output and activity levels change
Businesses categorise costs into two main types: fixed costs and variable costs.
Fixed costs
Key Concept: Fixed costs remain constant regardless of how much a business produces. These costs must be paid whether the business is producing nothing or operating at full capacity.
Common examples of fixed costs include:
- Rent and business rates
- Employee salaries
- Marketing expenses such as advertising and market research
- Insurance premiums
- Interest payments on loans
- Lease payments for equipment
It's important to understand that while these costs are called "fixed," they can change over time. For example, office rent might remain the same for several years, but when the lease is renewed, it could increase or decrease. The key point is that fixed costs must be paid regardless of the business's sales performance.
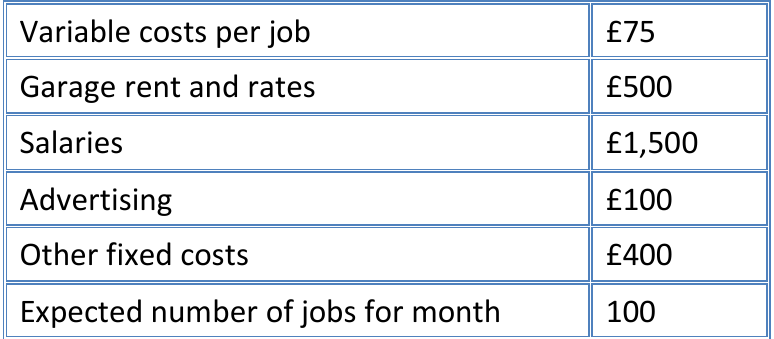
The table above shows how a garage business might break down its monthly costs. Notice how some costs remain the same regardless of how many repair jobs are completed.
Variable costs
Variable costs change in direct proportion to the level of business output. When production increases, variable costs rise accordingly. These costs are typically linked directly to the production or sale of products.
Examples of variable costs include:
- Raw materials and stock purchases
- Wages based on hours worked or pieces produced
- Sales-based marketing costs
- Commission payments to sales staff
You can calculate total variable costs using this simple formula:
Total costs
To understand the complete cost picture, businesses need to calculate their total costs. This involves adding fixed costs and variable costs together.
Essential Formula:
Worked Example: Graham's Van Repair Business
Based on the cost breakdown:
Step 1: Calculate variable costs Variable costs: £75 per job × 100 jobs = £7,500
Step 2: Calculate fixed costs Fixed costs: £500 (rent) + £1,500 (salaries) + £100 (advertising) + £400 (other costs) = £2,500
Step 3: Calculate total costs Total costs = £7,500 + £2,500 = £10,000
An important concept to remember is that as output increases, total costs don't rise as quickly because fixed costs remain constant. This leads to economies of scale, which is one of the key benefits of business growth.
Revenue and income
Revenue represents the money a business receives from selling its products or services. You can calculate revenue using this straightforward formula:
Revenue Formula:
Most businesses sell multiple products at different prices, making the calculation more complex in practice, but the basic principle remains the same.
Using Graham's example, if he charges £100 for each repair job and completes 100 jobs, his revenue would be: £100 × 100 = £10,000.
Profit and loss calculations
Once you know both total costs and revenue, you can determine whether a business is profitable. Profit represents the financial reward that business owners receive for taking risks and investing in their venture. It's also a crucial indicator for potential lenders and investors.
Profit serves multiple purposes:
- It rewards business owners for the risks they take
- It signals to banks and suppliers that the business is financially viable
- It provides a source of finance for future growth through retained profits
- It demonstrates the business's ability to repay debts
Fundamental Profit Formula:
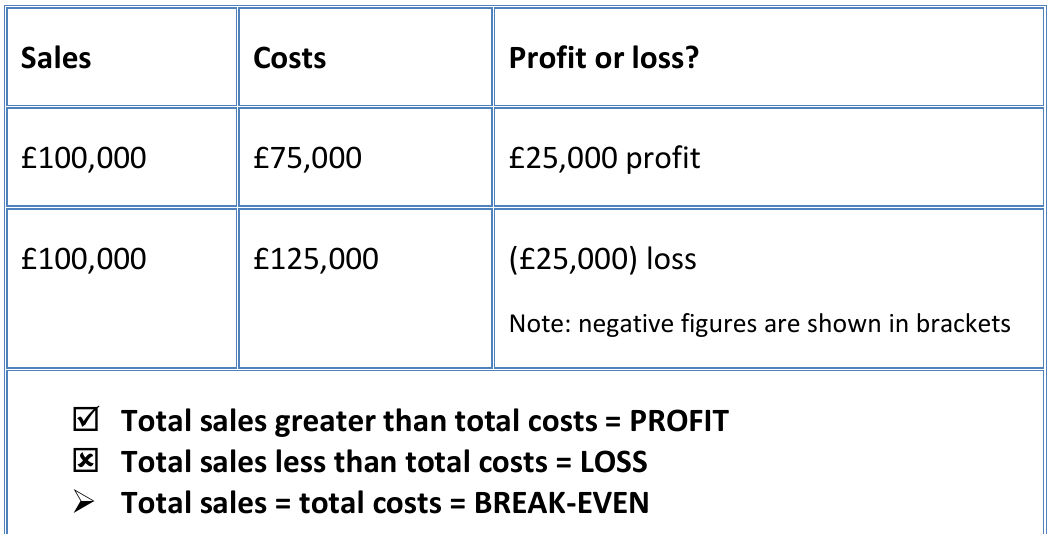
This table illustrates how the same sales figure can result in either profit or loss depending on the cost level. When costs exceed sales, the business makes a loss, typically shown in brackets.
The relationship between sales, costs, and outcomes can be summarised as:
- Total sales greater than total costs = Profit ✓
- Total sales less than total costs = Loss ✗
- Total sales equal to total costs = Break-even →
Regardless of the outcome, businesses must regularly review their performance and consider how to improve. This might involve reducing costs, increasing revenue through higher prices, or selling more products.
Investment appraisal using average rate of return
Businesses constantly seek ways to improve their performance and profitability. Most improvement strategies require investment, where money is spent today to generate benefits in the future. Investment opportunities typically fall into three categories:
- Expansion: Spending on new locations, product lines, or facilities to increase output
- Replacement: Investing in new machinery or equipment to replace worn-out items
- Modernisation and mechanisation: Adopting new technology to improve production methods or move from labour-intensive to capital-intensive processes
To evaluate whether an investment is worthwhile, businesses use various calculations. One popular method is the average rate of return (ARR).
Average rate of return calculation
The average rate of return provides a simple way to assess investment projects by calculating the annual average return as a percentage. This allows comparison with other potential investments, savings interest rates, or borrowing costs.
Average Rate of Return Formula:
Where: Average annual profit =
Worked Example: Fast Food Delivery Van Investment
A fast food business considers expanding its delivery service by purchasing a van for £30,000. If the van lasts 5 years and generates an additional £22,500 profit over this period:
Step 1: Calculate average annual profit Average annual profit = £22,500 ÷ 5 = £4,500
Step 2: Apply ARR formula ARR = (£4,500 × 100) ÷ £30,000 = 15%
Conclusion: This 15% return would be considered quite good, especially if the business needs to borrow money to fund the investment.
Break-even analysis
Break-even analysis helps businesses understand how much they need to produce and sell to cover all their costs. The break-even point occurs where total revenue equals total costs, meaning the business makes neither profit nor loss.
Understanding break-even is crucial for business planning as it shows the minimum sales volume needed to avoid losses. Once this point is reached, any additional sales contribute directly to profit.
Break-even charts and graphs
Break-even information is often presented visually through charts that show the relationship between sales volume, costs, and revenue.
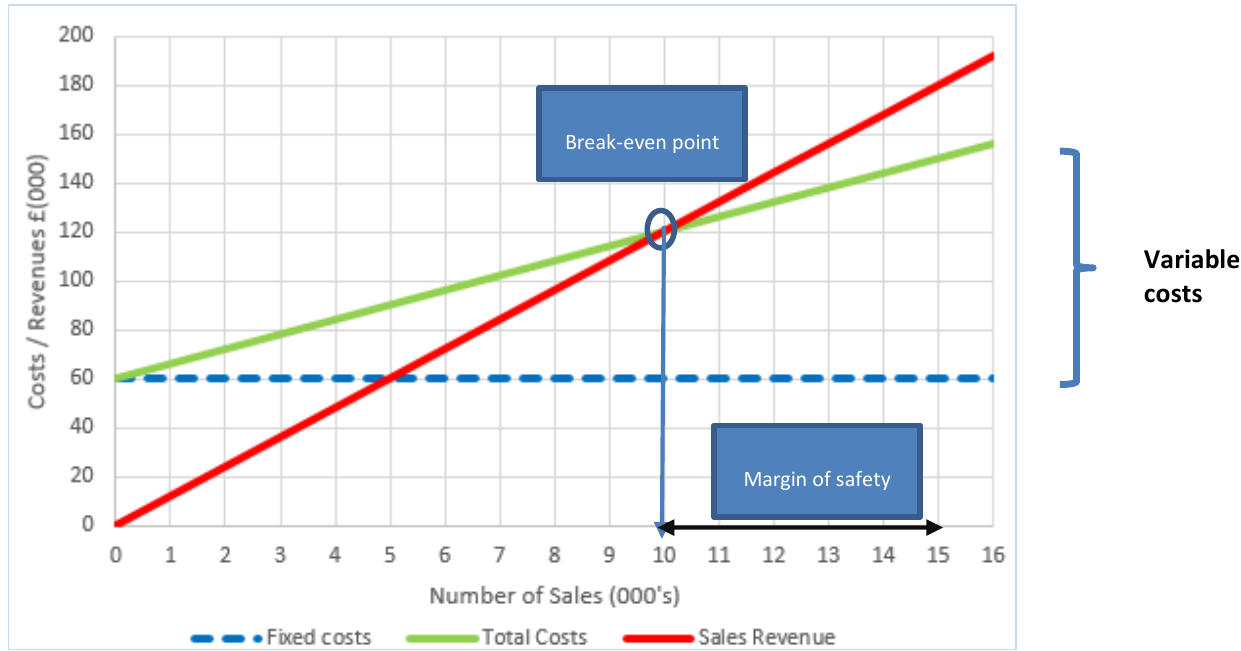
This break-even chart demonstrates several key concepts:
- Fixed costs appear as a horizontal line because they don't change with output
- Total costs start at the fixed cost level and rise as variable costs are added
- Revenue starts at zero and increases diagonally as more units are sold
- Break-even point occurs where the total costs and revenue lines intersect
In this example, the business breaks even at 10,000 units of sales. Below this level, costs exceed revenue, resulting in losses. Above this level, revenue exceeds costs, generating profit.
Margin of safety
The margin of safety represents the difference between current sales levels and the break-even point. It shows how much sales could fall before the business starts making losses.
Worked Example: Calculating Margin of Safety
If the business in the chart currently sells 15,000 units:
Margin of safety = 15,000 (current sales) - 10,000 (break-even point) = 5,000 units
Interpretation: A larger margin of safety indicates a more secure position, as it shows how much sales can drop before the business faces difficulties.
Benefits and limitations of break-even analysis
Break-even analysis offers several advantages:
- It quickly illustrates the impact of different output levels on profitability
- It helps with decision-making about pricing and cost management
- Businesses can conduct "what if" analyses by changing variables and observing the effects
Limitations to Consider:
- It assumes selling prices remain constant regardless of volume
- It assumes all products produced will be sold at the expected price
- It becomes complicated for businesses with multiple products and services
- It assumes variable costs increase proportionally with output, which may not always be true
- It might encourage businesses to focus solely on breaking even rather than maximising profits
Key Points to Remember:
- Fixed costs stay the same regardless of production levels, while variable costs change with output
- - this is your fundamental cost equation
- - if costs exceed sales, you have a loss
- Average rate of return helps evaluate investments by showing annual returns as a percentage
- Break-even point is where total revenue equals total costs - beyond this point, you start making profit
- Margin of safety shows how much sales can fall before you start losing money