Graphs of exponential functions (AQA GCSE Further Maths): Revision Notes
Graphs of exponential functions
What are exponential functions?
An exponential function is a special type of mathematical function where the variable appears as an exponent (power). In these functions, you'll see the variable in positions like , where 'a' is a positive real number called the base, and 'x' is the variable.
Common examples of exponential functions include:
The key thing to remember is that the variable is in the exponent position, not the base. This makes exponential functions behave very differently from other types of functions you've studied.
Key characteristics of exponential graphs
The magic point (0, 1)
Here's something really important about exponential functions: all graphs with the form pass through the point (0, 1). This happens because any number raised to the power of 0 equals 1. So when , , regardless of what 'a' is (as long as ).
This makes (0, 1) a reference point that you can always count on when sketching exponential graphs. Remember: when , for any function of the form .
Exponential growth vs exponential decay
Exponential functions can show two main patterns: growth or decay. The difference depends on whether the base is greater than 1 or between 0 and 1.
Let's compare two important exponential functions: and .
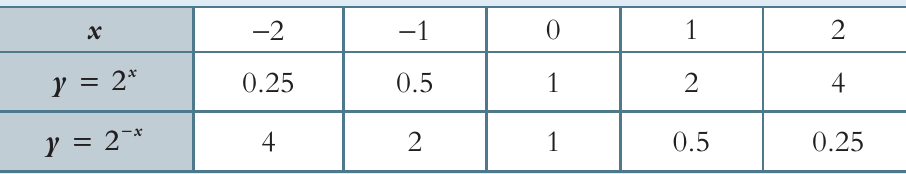
Looking at this comparison, you can see that:
- shows exponential growth: as x increases, y increases rapidly
- shows exponential decay: as x increases, y decreases towards zero
These two functions are actually reflections of each other. When you replace x with -x in an exponential function, you get the reflexion of the original graph across the y-axis.
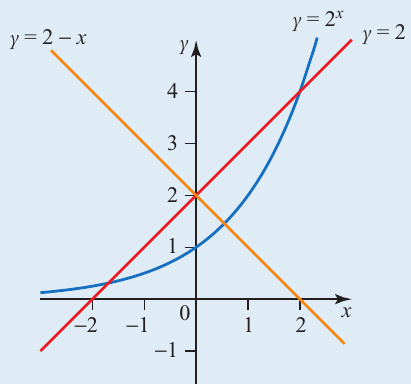
This graph shows how exponential functions compare with linear and constant functions. Notice how the exponential curve starts low on the left side and rises steeply on the right side, while still passing through that crucial point (0, 1).
Finding parameters in exponential functions
Sometimes you'll need to find unknown values (parameters) in exponential functions when you're given specific points that lie on the curve. Here's how to approach this systematically:
Worked Example: Finding Parameters in
Given points: (0, 0.5) and (3, 0.004)
Step 1: Substitute the first point into the equation When : Therefore:
Step 2: Substitute the second point with the known value of a When :
Step 3: Solve for b
Final answer:
Real-life applications
Exponential functions aren't just mathematical curiosities - they appear frequently in real-world situations. One important application is in radioactive decay, where the rate of decay is proportional to the amount of material present.
Common Real-Life Applications:
- Population growth and decline
- Compound interest calculations
- Radioactive decay in physics
- Bacteria growth in biology
- Temperature cooling (Newton's Law of Cooling)
In these applications, you might encounter equations like , where:
- 'a' represents the initial amount
- 'b' relates to the rate of decay
- 'x' represents time
The same parameter-finding techniques you've learned can be applied to solve real problems involving population growth, compound interest, radioactive decay, and many other exponential phenomena.
Common exam techniques
When working with exponential functions, these strategies will help you succeed:
- Always check if the graph passes through (0, 1) for functions of the form
- Use tables of values to plot accurate graphs, especially for negative x-values
- Remember the reflexion property: is the reflexion of across the y-axis
- When finding parameters, substitute coordinates systematically and use the fact that
- Distinguish between growth and decay: positive exponents typically mean growth, negative exponents mean decay
Common Mistake to Avoid: Don't confuse exponential functions with power functions. In , the variable is in the exponent. In , the variable is in the base.
Key Points to Remember:
- All exponential functions of the form pass through the point (0, 1) - this is your anchor point
- shows exponential growth (values increase rapidly), while shows exponential decay (values decrease towards zero)
- To find unknown parameters, substitute given coordinate points into the equation and solve systematically
- Exponential functions model many real-world phenomena like population growth and radioactive decay
- The reflexion property means that changing x to -x reflects the graph across the y-axis