Graphs of linear functions (AQA GCSE Further Maths): Revision Notes
Graphs of linear functions
Understanding linear functions
Linear functions are mathematical relationships that create straight lines when plotted on a coordinate plane. The word linear literally means relating to a line, and these functions are fundamental building blocks in algebra. When you see a linear function graphed, it will always appear as a perfectly straight line that extends infinitely in both directions.
The most important characteristic of any straight line is its steepness, which mathematicians call the gradient or slope. The gradient tells us how quickly the line rises or falls as we move from left to right across the graph.
We typically use the letter m to represent the gradient in equations. Understanding gradient is essential for working with linear functions, as it determines the line's direction and steepness.
Calculating the gradient of a line
The gradient measures how much the y-coordinate changes compared to how much the x-coordinate changes between any two points on the line. To find this, we use a simple but powerful formula.
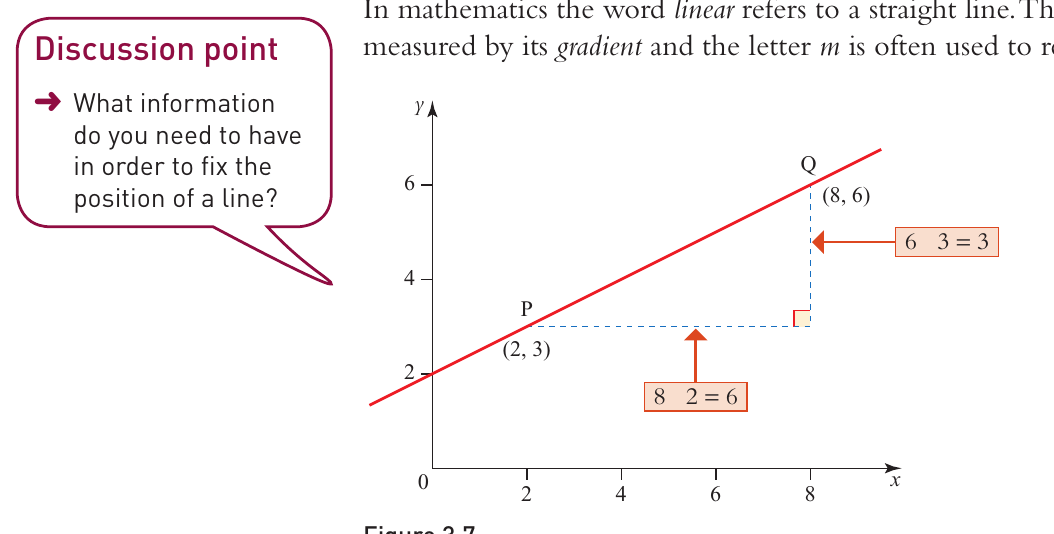
When you have two points on a line, such as P(2, 3) and Q(8, 6), you can calculate the gradient by finding the vertical change (rise) and dividing it by the horizontal change (run). The formula is:
gradient = (change in y-coordinate from P to Q) ÷ (change in x-coordinate from P to Q)
In mathematical notation, this becomes:
Worked Example: Calculating Gradient
For points P(2, 3) and Q(8, 6):
Step 1: Identify the coordinates
- Point P:
- Point Q:
Step 2: Apply the gradient formula
Therefore, the gradient equals .
It doesn't matter which point you call and which you call - you'll get the same result either way, as long as you're consistent with your calculation.
Types of gradients
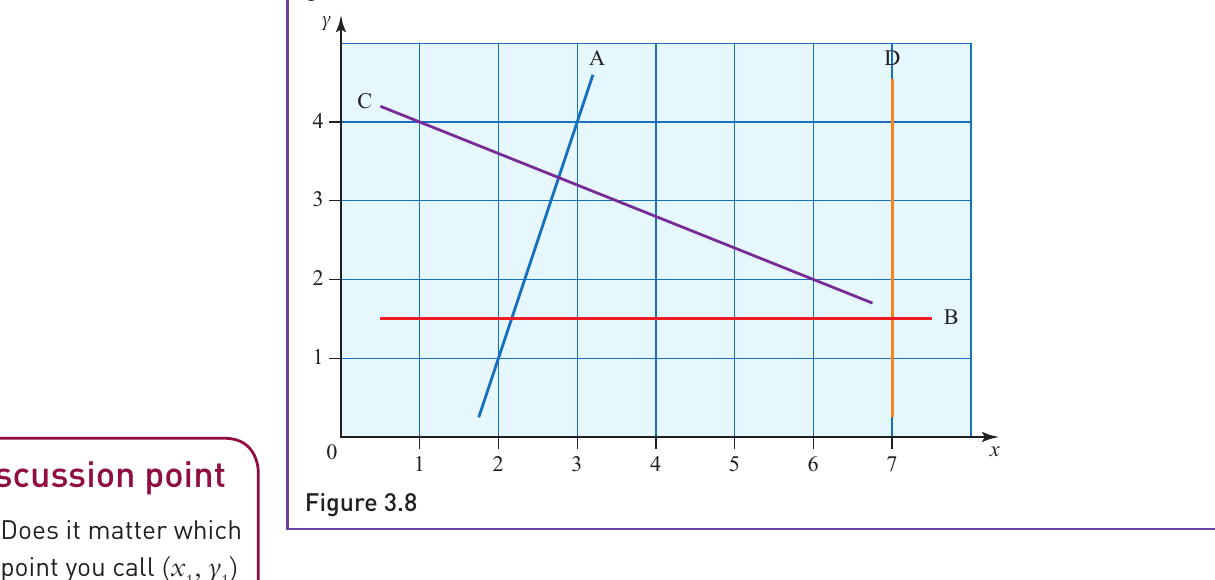
Understanding the different types of gradients helps you quickly identify what a line will look like just by examining its equation or calculating its gradient value.
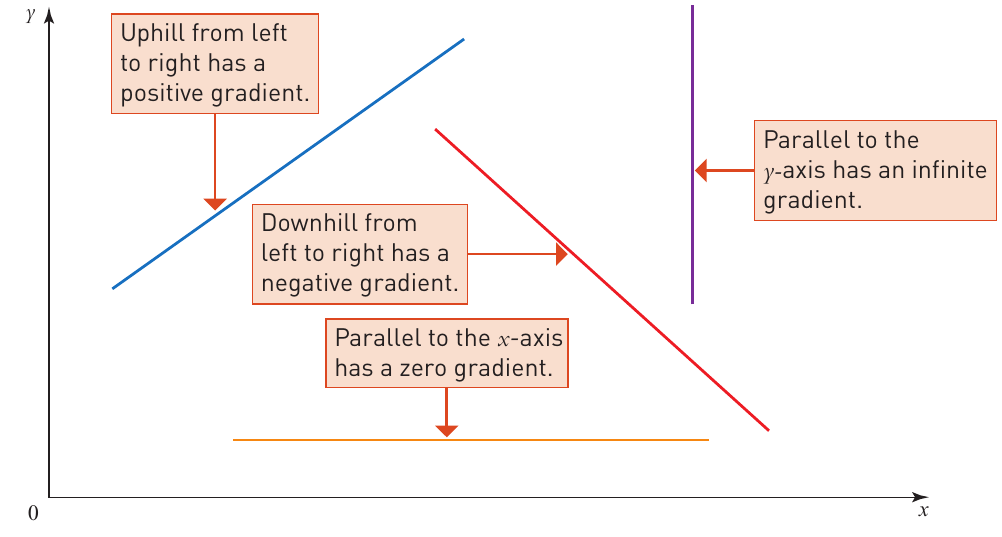
Positive gradients occur when lines slope upward from left to right. These lines climb as you move across the graph. The steeper the positive gradient, the more dramatically the line rises.
Negative gradients create lines that slope downward from left to right. These lines fall as you move across the graph. A larger negative number means a steeper downward slope.
Zero gradients produce perfectly horizontal lines that run parallel to the x-axis. No matter how far you travel horizontally, the y-value stays exactly the same.
Infinite gradients result in perfectly vertical lines that run parallel to the y-axis. These lines have an undefined gradient because you would be dividing by zero in the gradient formula.
Quick Gradient Recognition:
- Positive numbers: line slopes upward ↗
- Negative numbers: line slopes downward ↘
- Zero: horizontal line →
- Undefined/infinite: vertical line ↑
Finding the equation of a straight line
Once you understand gradients, you can work backwards to find the equation that describes any straight line. This process involves using the gradient and a known point to build the complete equation.
Worked Example: Finding Line Equation
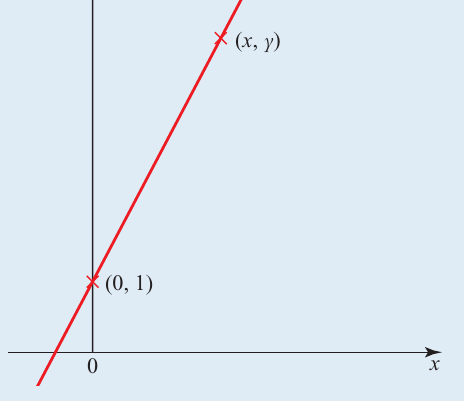
Find the equation of a line with gradient 2 that passes through the point (0, 1).
Step 1: Take any general point on the line
Step 2: Set up the gradient formula The gradient between and must equal 2:
Step 3: Solve for y Since the gradient equals 2:
Step 4: Rearrange to standard form
This gives us the equation in the standard form .
Standard forms of linear equations
Linear equations can be written in several different standard forms, each with its own advantages depending on what information you have or what you need to find.
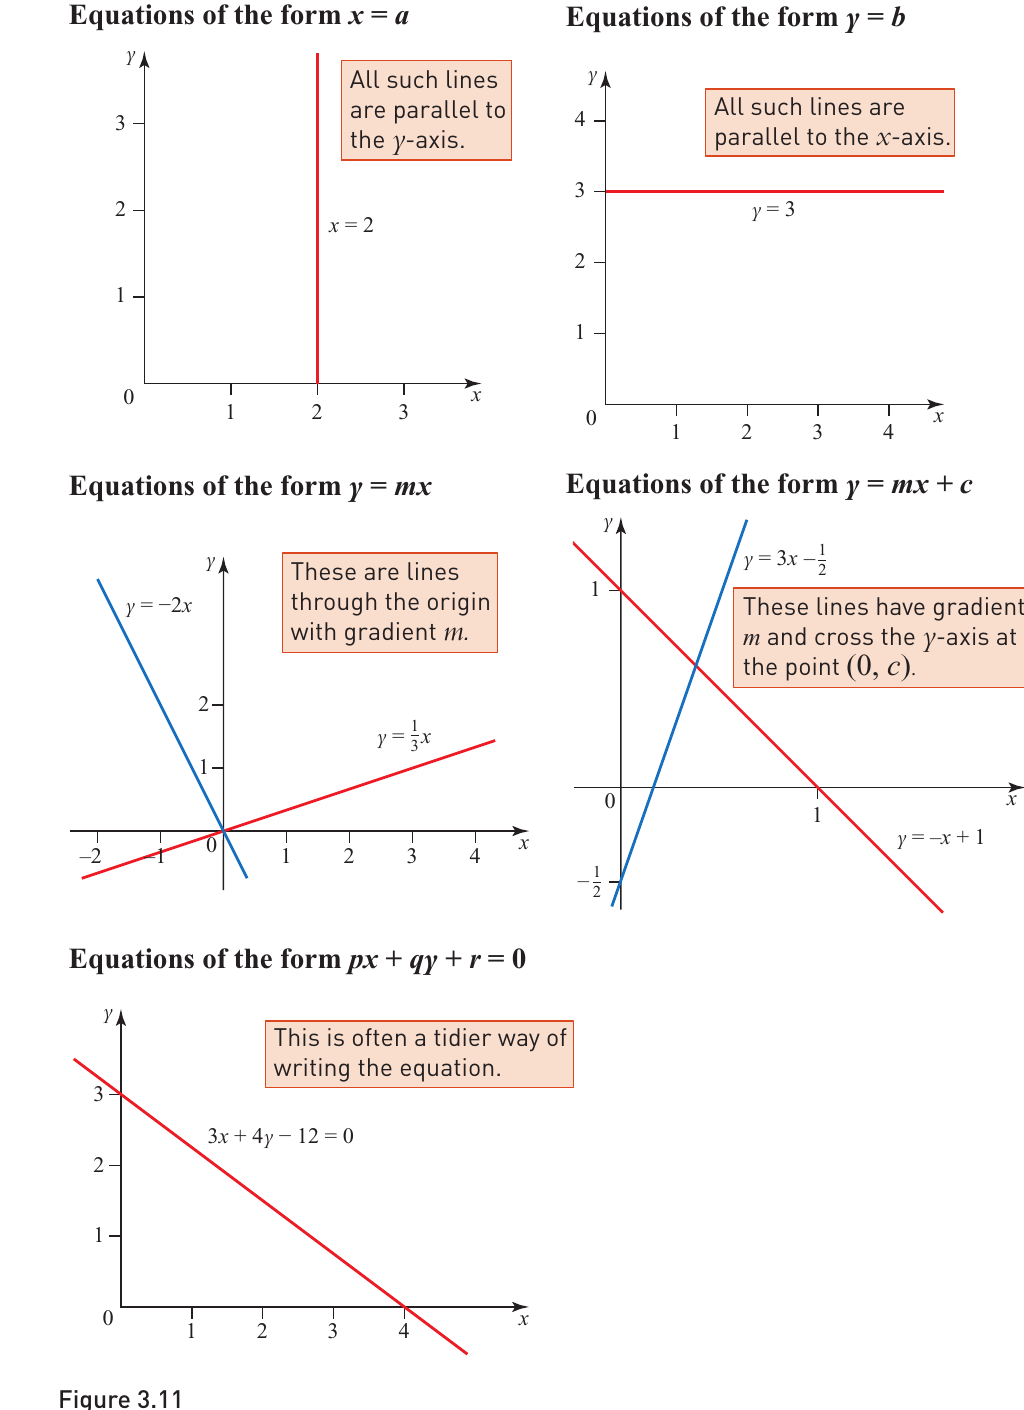
Vertical lines : These equations create perfectly vertical lines. For example, is a vertical line that passes through every point where the x-coordinate equals 2. These lines are parallel to the y-axis and have infinite gradient.
Horizontal lines : These equations create perfectly horizontal lines. For example, is a horizontal line that passes through every point where the y-coordinate equals 3. These lines are parallel to the x-axis and have zero gradient.
Lines through the origin : These equations describe lines that pass through the origin point (0, 0). The value of determines the gradient. Examples include (negative gradient) and (positive gradient).
Lines with y-intercept : This is the most common form, where represents the gradient and represents where the line crosses the y-axis. Examples include and .
General form : This form is sometimes considered tidier for certain calculations. For example, represents the same line as , just written differently.
Sketching lines from their equations
When you need to draw or sketch a line given its equation, the approach depends on which form the equation takes. Each form gives you different information that makes sketching straightforward.
For equations in the form , you can immediately identify two key pieces of information: the gradient tells you the line's steepness and direction, while tells you where the line crosses the y-axis. Start by plotting the y-intercept point , then use the gradient to find additional points.
For horizontal lines , simply draw a line parallel to the x-axis that passes through the point on the y-axis.
For vertical lines , draw a line parallel to the y-axis that passes through the point on the x-axis.
For equations in general form , the easiest approach is to find where the line crosses both axes. Set to find the y-intercept, and set to find the x-intercept. Plot these two points and draw the line through them.
Sketching Tips:
- Always start by identifying which form your equation is in
- For : plot the y-intercept first, then use the gradient
- For general form: find both x and y intercepts for two reliable points
- Use a ruler for accuracy and extend your line beyond the plotted points
Worked example: sketching multiple lines
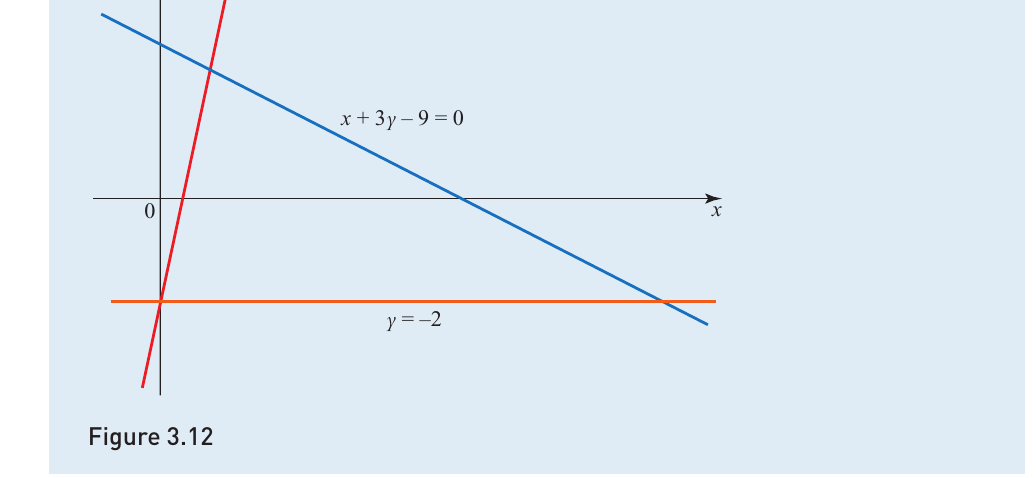
Worked Example: Sketching Three Lines
Sketch the following lines on the same coordinate system: , , and .
For : This is a horizontal line parallel to the x-axis that passes through the point .
For :
- Gradient: (positive, so slopes upward)
- Y-intercept: , so passes through
- Additional point: when , , giving point
For : Find the intercepts:
- When : , so . Point:
- When : , so . Point:
Plot these points and draw the line through them.
Key Points to Remember:
- Gradient formula: - this works for any two points on a line
- Positive gradients slope upward (left to right), negative gradients slope downward
- Standard form immediately shows you the gradient and y-intercept
- Horizontal lines have equation and zero gradient; vertical lines have equation and infinite gradient
- When sketching lines from general form equations, find the x and y intercepts by setting the other variable to zero