Cubic and reciprocal graphs (AQA GCSE Maths): Revision Notes
Cubic and reciprocal graphs
Understanding cubic and reciprocal graphs is essential for your GCSE maths exam. You'll need to recognise their shapes, draw them using tables of values, and interpret their key features.

What are cubic and reciprocal graphs?
These are two important types of non-linear graphs that appear frequently in GCSE questions. Each has distinctive characteristics that make them easy to identify once you know what to look for.
Both cubic and reciprocal graphs are classified as non-linear because they create curved lines rather than straight lines. Mastering their recognition and properties will help you tackle a wide range of exam questions.
Cubic graphs
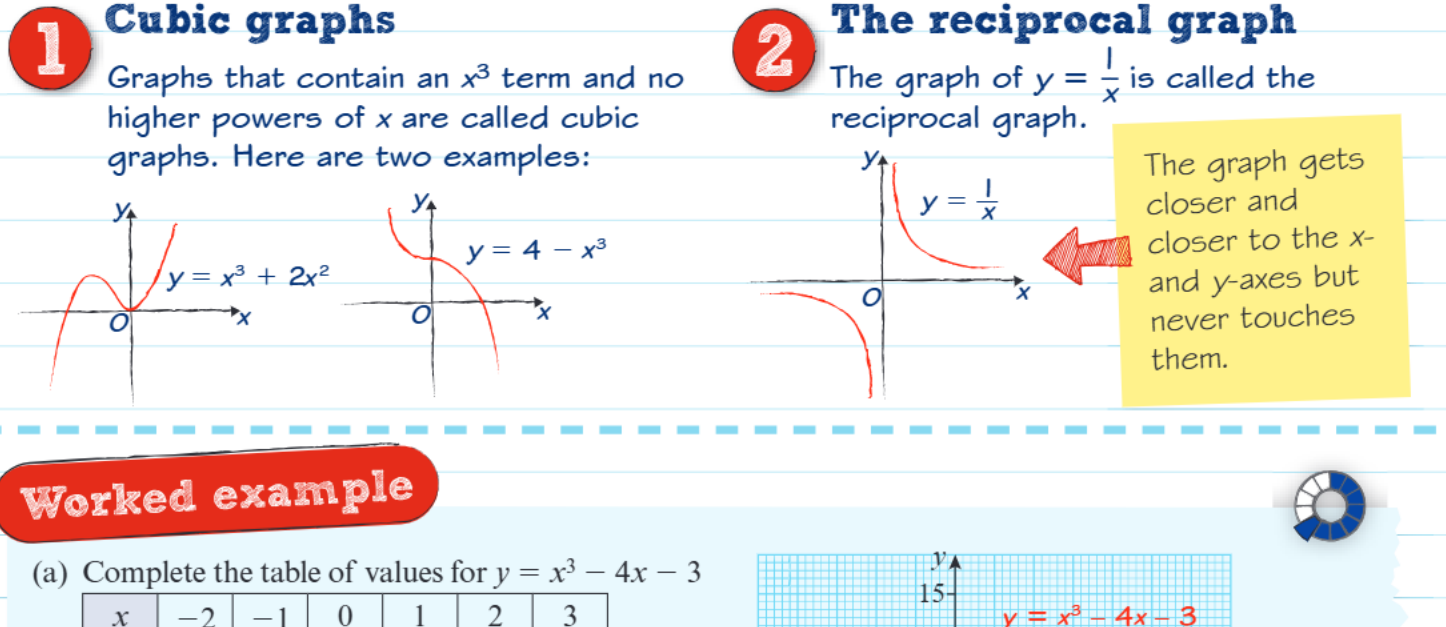
Cubic graphs contain an term as their highest power. They create smooth, curved lines with a characteristic S-shape.
Key features of cubic graphs
Cubic graphs have several distinctive characteristics that make them easily recognisable:
- Always contain an term (like , , or )
- Have no powers of x higher than 3
- Create smooth, continuous curves
- Can cross the x-axis up to 3 times
- Shape depends on whether the coefficient is positive or negative
Recognising cubic graph shapes
The direction of the curve depends entirely on the sign of the coefficient:
Positive coefficient rule:
- The curve starts from the bottom left and ends at the top right
- Creates an S-shape that flows upward
Negative coefficient rule:
- The curve starts from the top left and ends at the bottom right
- Creates an inverted S-shape that flows downward
Common cubic equations
Example: Typical Cubic Equations
Here are some cubic equations you might encounter in exams:
- (positive coefficient - curves upward)
- (negative coefficient - curves downward)
- (positive coefficient with linear term)
Reciprocal graphs
Reciprocal graphs have the equation and create a distinctive hyperbola shape.
Key features of reciprocal graphs
Reciprocal graphs have unique properties that distinguish them from all other graph types:
- The equation is always
- Create two separate curved branches
- One branch in the first quadrant (positive x and y)
- One branch in the third quadrant (negative x and y)
- The curves never touch the x-axis or y-axis
Understanding asymptotes
Asymptotes - The Key Feature
The most important feature of reciprocal graphs is their asymptotes. These are invisible lines that the curve approaches but never actually touches:
- The curve gets closer and closer to both axes
- It never reaches or
- The branches continue infinitely in both directions
This happens because you cannot divide 1 by 0, so the graph can never actually reach either axis.
Working with tables of values
When drawing cubic graphs, you'll often complete a table of values first. This systematic approach helps you plot accurate points before drawing the smooth curve.
Steps for using tables of values
Follow this methodical process to ensure accuracy:
- Substitute each x-value into the equation
- Calculate the corresponding y-values carefully
- Plot the coordinates on a graph
- Draw a smooth curve through all points
Always double-check your calculations when completing tables of values. Small arithmetic errors can significantly affect the shape of your final graph.
Finding intersection points
You can use graphs to solve equations by finding where different curves meet. This graphical method provides visual solutions to complex equations.
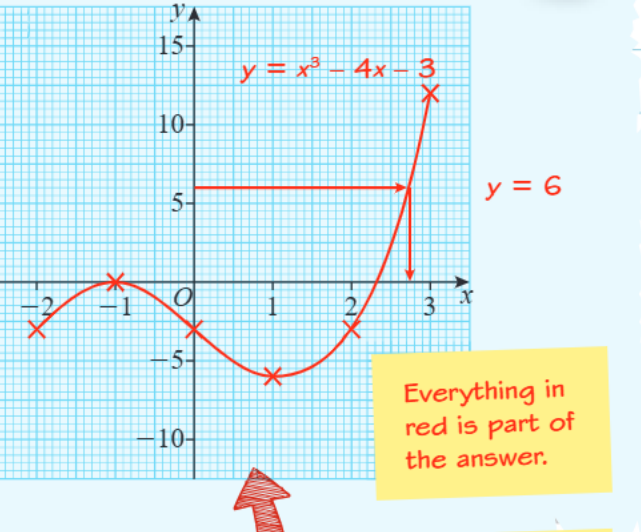
Worked Example: Solving Using Intersections
To solve , you would:
Step 1: Draw the curve
Step 2: Draw the horizontal line
Step 3: Find where they intersect
Step 4: Read the x-coordinates of intersection points
These x-coordinates are the solutions to your original equation.
Exam tips
Successful graph work requires both technical accuracy and strategic thinking:
- Recognise the shape before you start plotting - this helps check your work
- Use a table of values systematically to avoid calculation errors
- Draw smooth curves - cubic and reciprocal graphs have no sharp corners
- Label your graphs clearly with their equations
- Check your scale carefully when reading values from graphs
Remember that graphical solutions are often estimates, so comment on accuracy when asked. Examiners appreciate when you acknowledge the limitations of graphical methods.
Key Points to Remember:
- Cubic graphs contain terms and make S-shaped curves
- Positive coefficient = curve goes from bottom-left to top-right
- Negative coefficient = curve goes from top-left to bottom-right
- Reciprocal graphs () create hyperbolas with two separate branches
- Asymptotes are invisible boundaries that reciprocal curves approach but never touch