Distance-time graphs (AQA GCSE Maths): Revision Notes
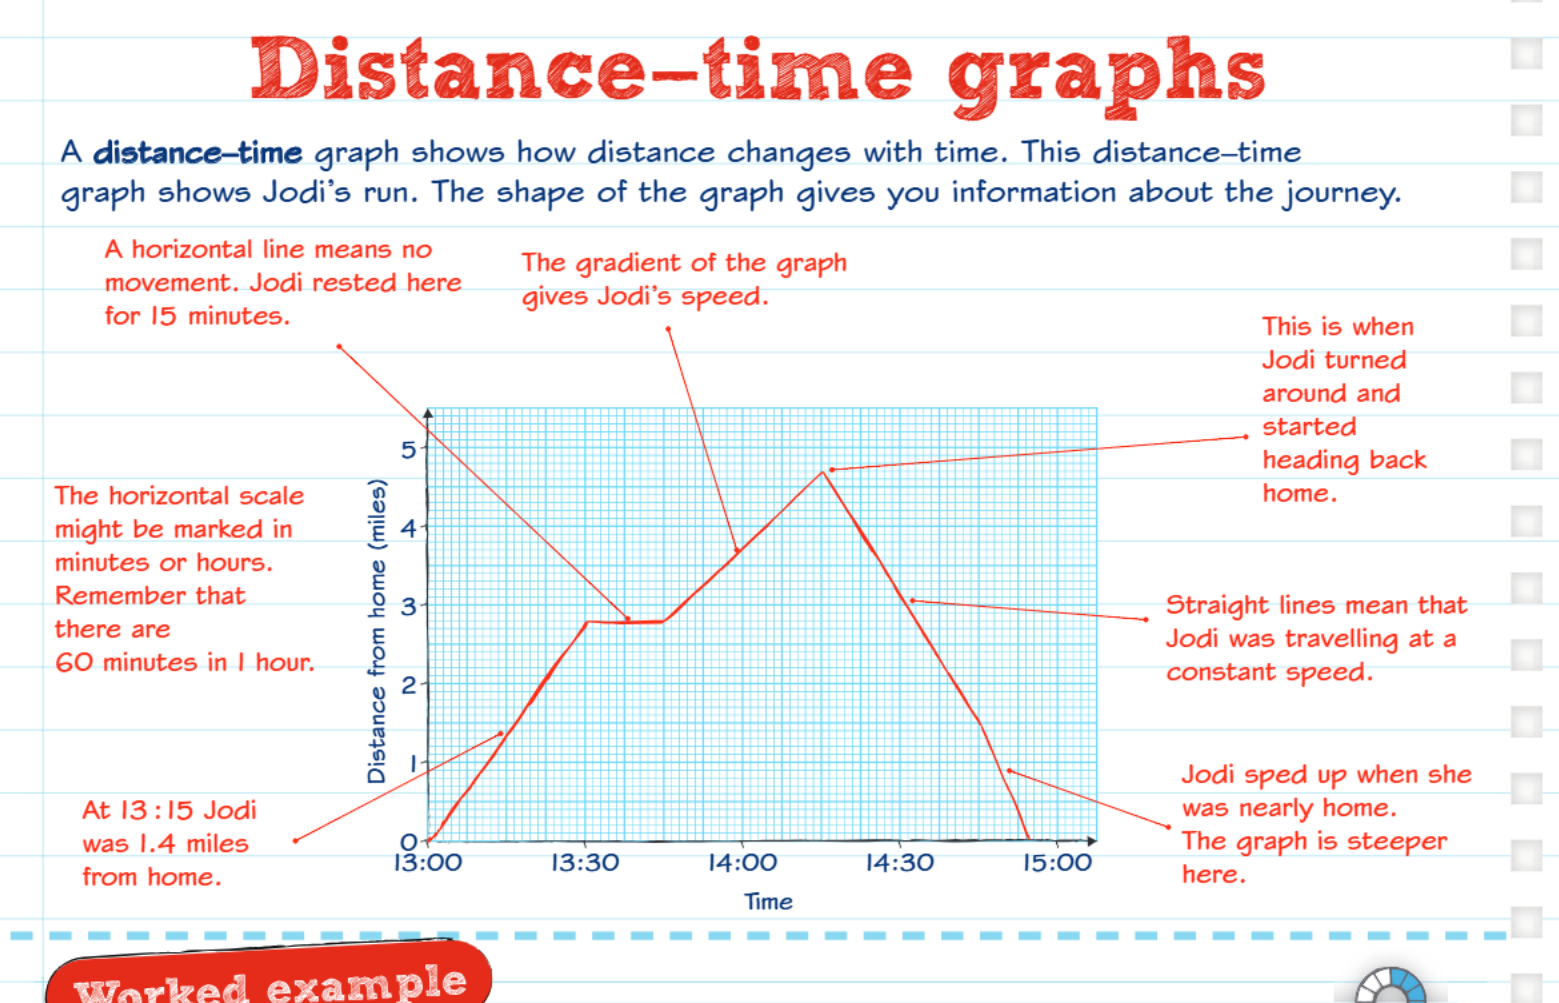
Distance-time graphs
What is a distance-time graph?
A distance-time graph is a visual way to show how far someone or something is from a starting point at different times during a journey. These graphs help us understand movement patterns and calculate speeds.
Understanding the axes is crucial for interpreting these graphs correctly. The distance axis shows how far you are from your starting point, not the total distance you've travelled.
The graph has:
- Time on the horizontal axis (x-axis)
- Distance from a starting point on the vertical axis (y-axis)
Key features to understand
Horizontal lines
When you see a horizontal line on the graph, this means:
- No movement is happening
- The person or object is staying in the same place
- They are resting or stationary
Sloped lines
Sloped lines indicate movement:
- Steeper slopes = faster movement
- Gentler slopes = slower movement
- Straight lines = constant speed (steady movement)
The gradient tells us about speed
The gradient (steepness) of a line shows the speed:
- Steeper gradient = higher speed
- Flatter gradient = lower speed
- The gradient can be calculated to find the exact speed
Think of gradient like a hill - the steeper the hill, the harder it is to climb, and the faster you'd roll down it. Similarly, steeper gradients on distance-time graphs represent faster speeds.
Reading distance-time graphs
When interpreting these graphs, look for:
- Starting position: Where the journey begins on the distance axis
- Direction of travel:
- Lines going up = moving away from start
- Lines going down = returning towards start
- Rest periods: Horizontal sections where distance stays the same
- Speed changes: Where the steepness of the line changes
Remember that distance-time graphs show your position relative to a starting point, not the total distance you've travelled. If you go 10km away and then return to 5km from start, the graph shows 5km, not 15km total travelled.
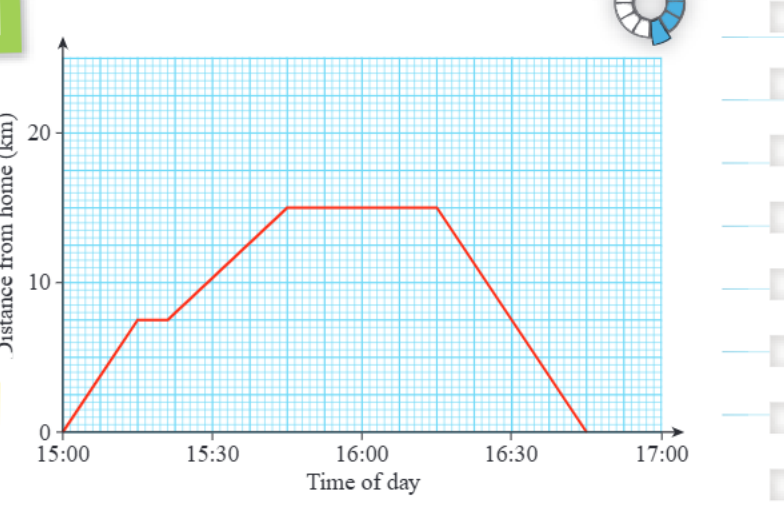
Calculating speed from graphs
You can find speed using the gradient of the line:
For average speed over a whole journey:
- Use the total distance travelled
- Divide by the total time taken
Worked Example: Finding Speed from a Graph
If a cyclist moves from 0km to 15km in 30 minutes:
Step 1: Identify the distance change Distance = 15km - 0km = 15km
Step 2: Identify the time taken Time = 30 minutes = 0.5 hours
Step 3: Apply the formula Speed =
Common Exam Mistakes to Avoid:
- Always check the time scale - it might be in minutes or hours
- Remember there are 60 minutes in 1 hour when converting
- Flat sections always mean resting or no movement
- The steepest part of the graph shows the fastest speed
- Read coordinates carefully to get accurate values
Key Points to Remember:
- Horizontal lines = no movement (resting)
- Gradient = speed (steeper = faster)
- Straight lines = constant speed
- Distance-time graphs show position from start, not total distance travelled
- Always check your time units (minutes vs hours)