Rates of change (AQA GCSE Maths): Revision Notes
Rates of change
What are rates of change?
A rate of change tells us how quickly one quantity changes compared to another. In mathematics, we often look at how things change over time.
The fundamental formula for rate of change is:
For example, if the temperature increases by 10°C in 2 hours, the rate of change is 5°C per hour.
Rate of change is a fundamental concept that appears throughout mathematics and science. It helps us understand how variables relate to each other and how systems change over time.
Distance-time graphs
A distance-time graph shows how distance changes over time. The gradient (steepness) of the line tells us the speed.
- Steep gradient = fast speed
- Gentle gradient = slow speed
- Horizontal line = not moving
- Curved line = changing speed
When reading these graphs, remember that we're looking at the rate of change of distance with time.
The gradient of a distance-time graph gives us velocity. This is because gradient = rise/run = change in distance/change in time = velocity.
Reading rates from graphs
Let's look at how rates work in real situations.
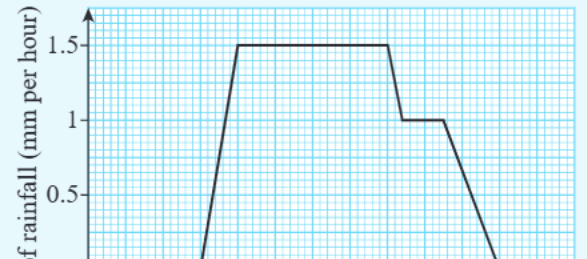
Worked Example: Interpreting a Rainfall Graph
This rainfall graph shows how the rate of rainfall changes throughout a storm. Notice how:
- The rate starts at zero (no rain)
- It jumps to about 1.5mm per hour (heavy rain)
- It stays constant for a period
- It drops to 1mm per hour (lighter rain)
- Finally returns to zero (rain stops)
The horizontal sections show constant rates, while the vertical jumps show instant changes in rate.
Velocity-time graphs
Velocity means speed in a particular direction. A velocity-time graph shows the rate of change of velocity with time.
The gradient of a velocity-time graph tells you the acceleration:
- Positive gradient = speeding up (accelerating)
- Negative gradient = slowing down (decelerating)
- Zero gradient = constant speed
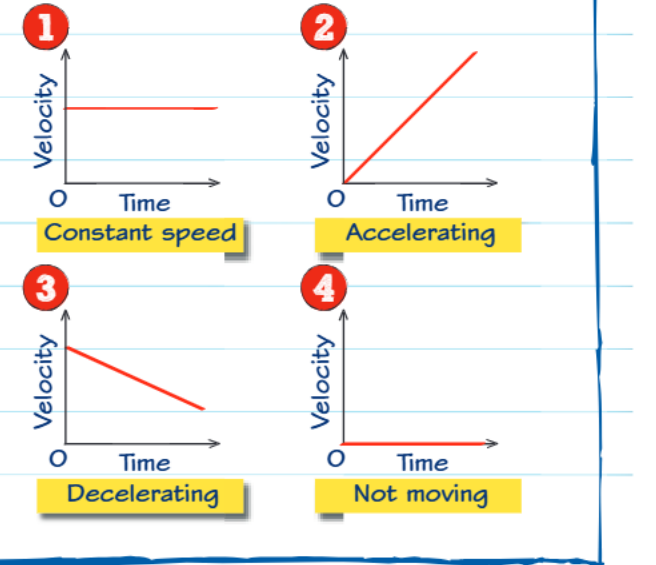
There are four main types of motion you need to recognise:
- Constant speed: Horizontal line - velocity stays the same
- Accelerating: Upward sloping line - velocity increases
- Decelerating: Downward sloping line - velocity decreases
- Not moving: Horizontal line at zero - no velocity
Complex motion patterns
Real journeys often involve multiple phases of motion, each with different rates of change.
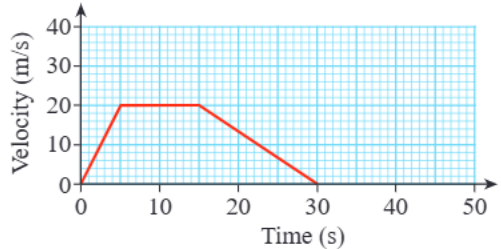
Worked Example: Multi-Phase Journey Analysis
This graph shows a journey with three distinct phases:
- Phase 1 (0-5s): Accelerating from rest to 20 m/s
- Phase 2 (5-15s): Constant speed at 20 m/s
- Phase 3 (15-30s): Decelerating back to rest
Notice how each phase has a different gradient, indicating different rates of change in velocity.
Common Mistakes to Avoid:
- Always check the axes labels - is it distance-time or velocity-time?
- Look at the gradient to determine what's happening
- Horizontal lines mean no change (constant value)
- Curved lines show changing rates
- The steeper the line, the greater the rate of change
Key Points to Remember:
- Rate of change compares how much one quantity changes relative to another
- Distance-time graphs: gradient shows speed
- Velocity-time graphs: gradient shows acceleration
- Horizontal lines represent constant values (no change)
- Always read the axes carefully to understand what the graph is showing