Straight-line graphs 1 (AQA GCSE Maths): Revision Notes
Straight-line graphs 1
Understanding linear equations
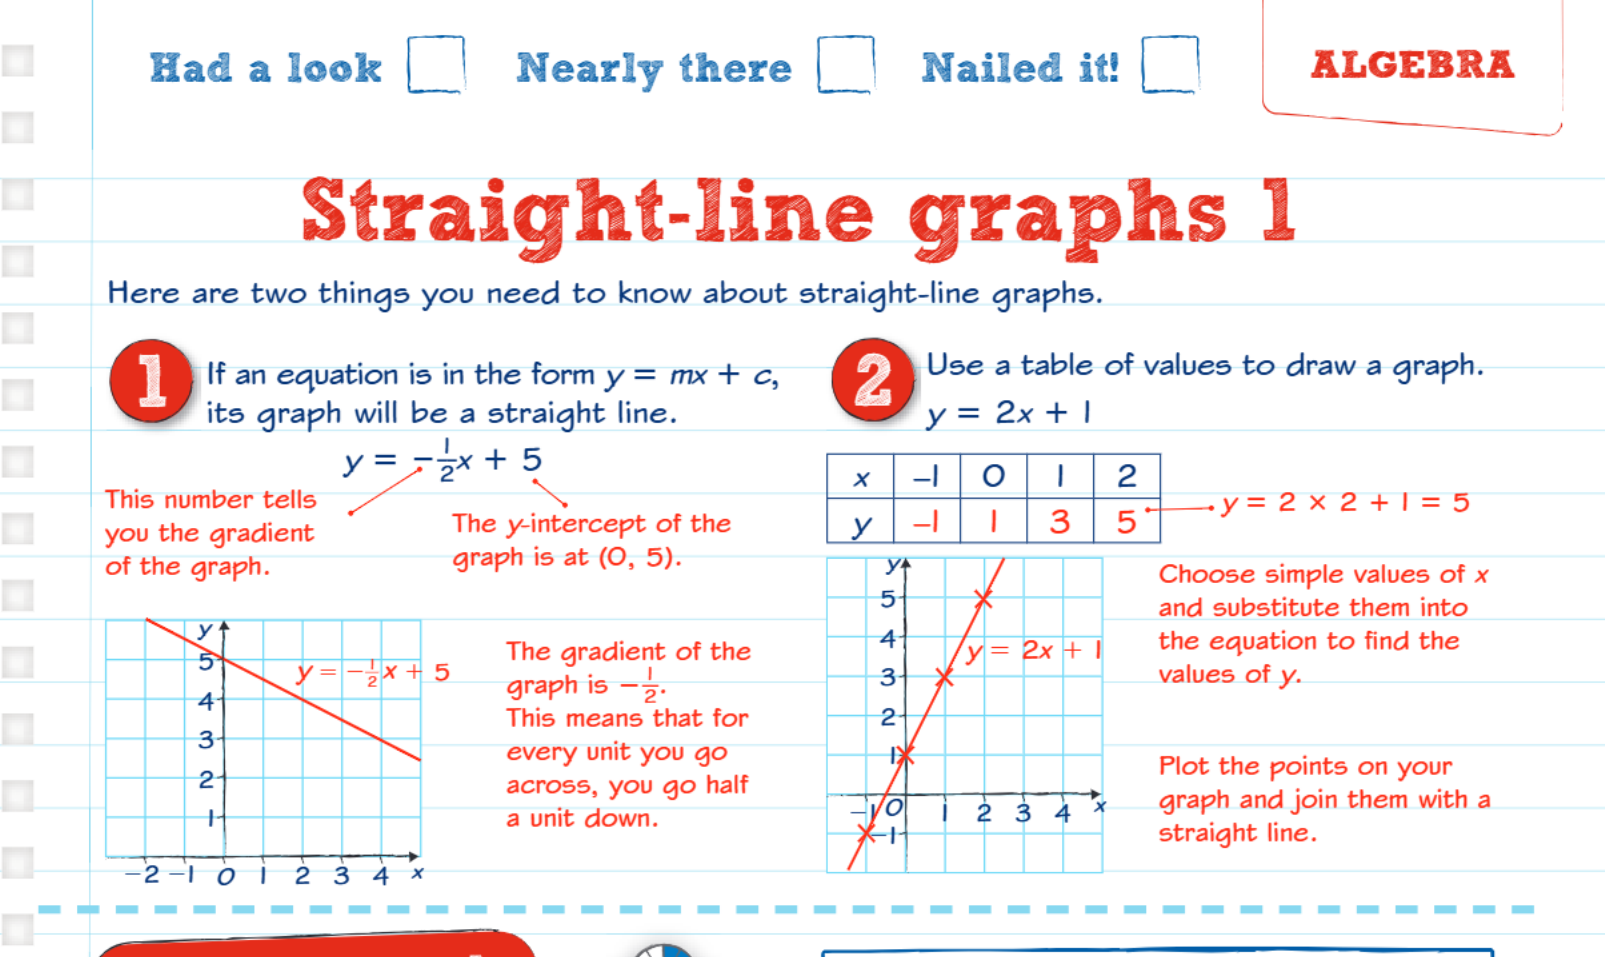
All equations written in the form produce straight-line graphs when plotted. This is the most important form to remember for linear equations.
The Standard Form:
In this equation:
- m represents the gradient (how steep the line is)
- c represents the y-intercept (where the line crosses the y-axis)
This form allows you to immediately identify the key characteristics of any straight line.
The gradient (m)
The gradient tells you how much the line slopes up or down. It shows the rate of change between x and y values.
- A positive gradient means the line slopes upwards from left to right
- A negative gradient means the line slopes downwards from left to right
- The larger the number, the steeper the slope
Understanding Gradient:
In this equation:
- The gradient is
- This means for every 1 unit you move right, you move unit down
- The negative sign indicates a downward slope from left to right
The y-intercept (c)
The y-intercept is the point where your straight line crosses the y-axis. This always happens when .
In :
- The y-intercept is 5
- The line crosses the y-axis at the point
Drawing graphs using table of values
When you need to plot a straight-line graph, creating a table of values is a reliable method that works for any linear equation.
Why Use a Table of Values?
A table of values provides multiple coordinate points that you can plot and connect. This method is particularly useful when the gradient or y-intercept isn't immediately obvious from the equation's form.
Steps to follow:
- Choose simple x values - usually start with
- Substitute each x value into your equation to find the corresponding y value
- Create coordinate pairs from your x and y values
- Plot these points on your graph
- Join the points with a straight line using a ruler
Worked Example: Plotting
Step 1: Create your table of values
- When : , giving point
- When : , giving point
- When : , giving point
Step 2: Plot these coordinate pairs on your graph
Step 3: Connect the points with a straight line using a ruler
Finding equations from graphs
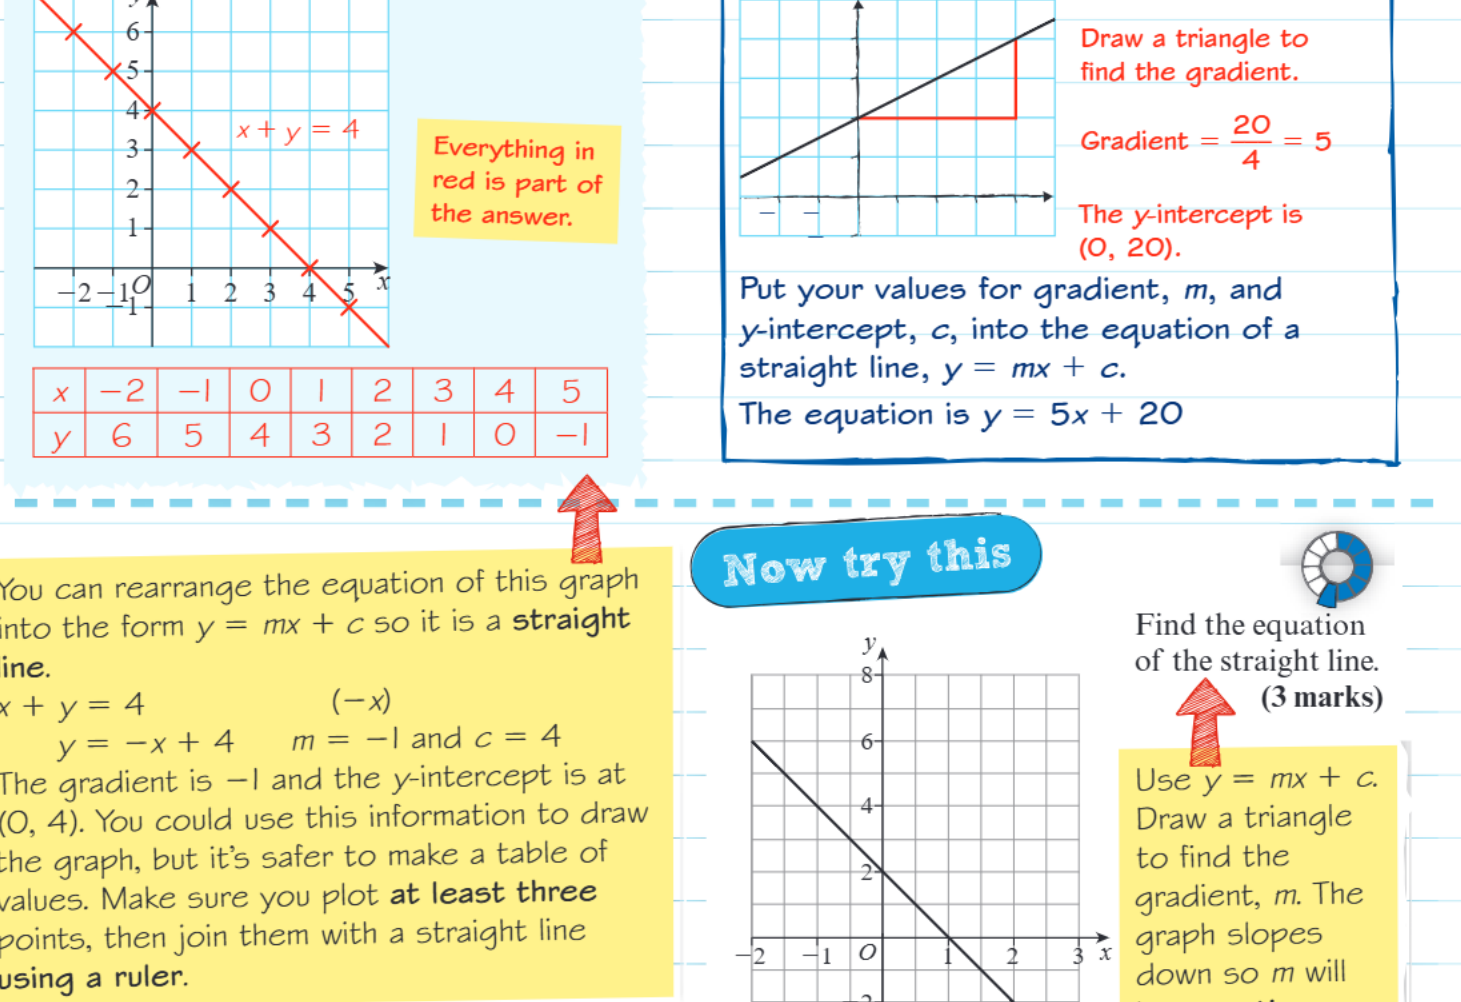
Sometimes you'll need to work backwards from a graph to find its equation. This involves identifying the gradient and y-intercept from the visual information.
Finding the gradient
To calculate the gradient from a graph, use the rise over run method:
- Draw a triangle between two clear points on the line
- Count the vertical change (rise)
- Count the horizontal change (run)
- Calculate: Gradient =
Direction Matters for Gradient
Remember to consider the direction:
- If the line goes up from left to right, the gradient is positive
- If the line goes down from left to right, the gradient is negative
Finding the y-intercept
Look at where your straight line crosses the y-axis. The y-coordinate of this point is your y-intercept (c value).
Writing the equation
Once you have both values:
- Put the gradient in place of m
- Put the y-intercept in place of c
- Write your equation in the form
Worked Example: Finding an Equation from a Graph
Looking at a line on a graph:
Step 1: Calculate the gradient
- The gradient triangle shows a rise of 20 and a run of 4
- Gradient =
Step 2: Identify the y-intercept
- The y-intercept is at
Step 3: Write the equation
- Therefore the equation is
Rearranging equations
Some equations might not be given in the standard form. You can rearrange them to make graphing easier.
Making Equations Graph-Ready
Not all linear equations are presented in the convenient form. Rearranging helps you quickly identify the gradient and y-intercept for easy graphing.
For example:
- Subtract x from both sides:
- Now you can see the gradient is and the y-intercept is
Key Points to Remember:
- All straight-line equations can be written in the form
- The gradient (m) shows how steep the line is and which direction it slopes
- The y-intercept (c) is where the line crosses the y-axis
- Table of values is a reliable method for plotting any linear graph
- Always use a ruler when drawing straight lines on graphs
- Check your work by ensuring all plotted points lie on your straight line