Using quadratic graphs (AQA GCSE Maths): Revision Notes
Using quadratic graphs
What are quadratic graphs?
Quadratic graphs are U-shaped curves (called parabolas) that represent equations containing an term. These graphs can open upwards or downwards and are essential for solving quadratic equations visually.
You can read values from quadratic graphs in two main ways:
- Looking at points where the graph crosses the x-axis
- Drawing horizontal lines on your graph to find specific values
Creating a table of values
To draw a quadratic graph, you first need to create a table of values. This systematic approach ensures accuracy when plotting your quadratic curve.
Worked Example: Creating a Table of Values
For the equation :
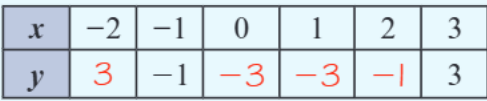
Key steps:
- Choose x-values (usually including negative and positive integers)
- Substitute each x-value into the equation
- Calculate the corresponding y-values
- Plot these coordinate pairs on a graph
The table of values forms the foundation for accurate graph plotting and helps you identify the key features of the quadratic curve.
Drawing the quadratic graph
Once you have your table of values, you can plot the graph using proper mathematical techniques:
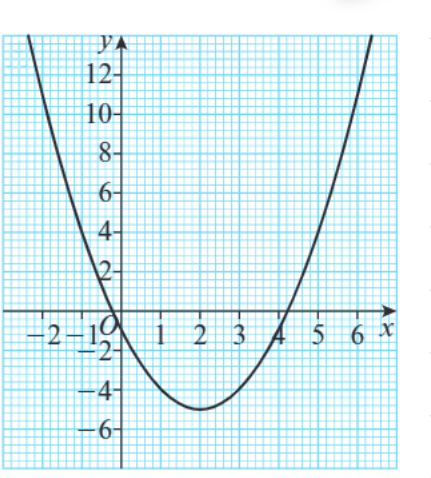
Critical Points for Drawing Quadratic Graphs:
- Always join points with a smooth curve, never straight lines
- Label your graph with its equation
- Use graph paper for accuracy
- The graph should be symmetrical
Remember that quadratic graphs have a distinctive smooth, curved shape that must be drawn carefully to maintain mathematical accuracy.
Finding solutions from graphs
The solutions of a quadratic equation like are the x-coordinates where the graph crosses the x-axis. These crossing points are also called the roots of the equation.
Worked Example: Finding Solutions Graphically
Method:
- Look where the curve crosses the x-axis (where )
- Read the x-values at these crossing points
- Read values accurate to the nearest small square on your graph
For the graph of , if it crosses the x-axis at and , then these are the solutions to .
This graphical method provides a visual understanding of how many solutions exist and their approximate values.
Using horizontal lines to solve equations
You can solve more complex equations like using your quadratic graph by employing the horizontal line method.
Worked Example: Solving Using Horizontal Lines
Method:
- Draw a horizontal line on the graph at the required y-value (in this case, )
- Find where this line crosses the curve
- Read down to the x-axis at these crossing points
- These x-values are your solutions
This method works because you're finding where the quadratic expression equals the constant value.
This technique extends the usefulness of your quadratic graph beyond finding simple roots.
Exam tips
Essential Exam Strategies:
- Always read graphs carefully - accuracy is important
- Use a ruler when drawing horizontal lines
- Check your answers make sense by substituting back into the original equation
- Show your working by indicating where you read values from the graph
- Round answers to 1 decimal place unless told otherwise
Remember!
Key Points to Remember:
- Quadratic graphs are always smooth U-shaped curves - never join points with straight lines
- Solutions to quadratic equations are found where the graph crosses the x-axis
- Use horizontal lines to solve equations where the quadratic expression equals a specific value
- Always label your graphs with their equations
- Read values accurately from the graph using the grid squares to help you