Frequency and outcomes (AQA GCSE Maths): Revision Notes
Frequency and outcomes
What are frequency and outcomes?
When dealing with probability problems involving multiple events, you need to consider all the possible outcomes that could happen. Frequency refers to how often each outcome occurs in your data set.
You can use special tools called frequency trees and sample space diagrams to organise and display this information clearly. These visual tools make complex probability problems much easier to understand and solve.
Frequency trees
What is a frequency tree?
A frequency tree is a diagram that shows the frequencies of each possible outcome when you have two or more events happening together. It uses branches to split the data into different categories, making it easier to see patterns and calculate probabilities.
The golden rule
The Golden Rule for Frequency Trees
The most important rule for frequency trees is the golden rule:
In a frequency tree, each frequency equals the sum of its branches.
This means that when you add up the numbers on the branches coming out of any point, they should equal the number at that point.
Worked example: Wilfred's books
Worked Example: Completing a Frequency Tree
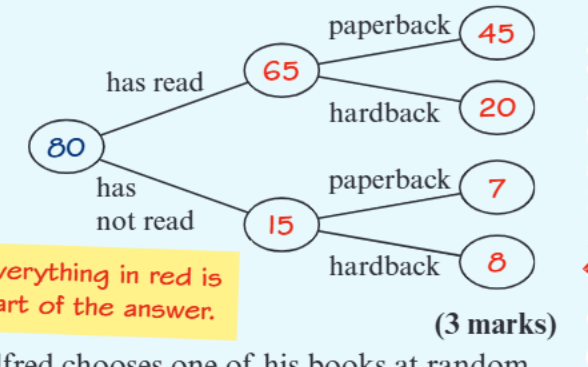
Wilfred owns 80 books total. He has not read 15 of these books, which means he has read 65 books. Of the books he has read, 20 are hardbacks and the rest are paperbacks. He has 52 paperbacks in total, and the remaining books are hardbacks.
Step 1: Write 15 in the bottom left oval (books not read)
Step 2: Calculate total hardbacks: hardbacks in total
Step 3: Since 20 hardback books have been read, then hardback books have not been read
Step 4: Use the golden rule to fill in all remaining branches
Result: The tree shows that if Wilfred chooses a book at random, the probability it's a paperback he hasn't read is .
Sample space diagrams
What is a sample space diagram?
A sample space diagram shows you all the possible outcomes when two events happen together. It's usually displayed as a table or grid format.
Worked Example: Flipping Two Coins
When you flip two coins, there are four possible outcomes:
- First coin heads, second coin heads (HH)
- First coin heads, second coin tails (HT)
- First coin tails, second coin heads (TH)
- First coin tails, second coin tails (TT)
This means getting a tail on the first coin and a head on the second coin is just one outcome out of four possible outcomes.
Practical probability applications
Counter bag example
You can use frequency information to solve probability problems effectively.
Worked Example: Counter Bag Problem
A bag contains 30 counters that are either black or white. The probability of picking a black counter is .
Step 1: Find P(White) using complementary probability Since , then
Step 2: Calculate number of white counters white counters
Step 3: Find number of black counters black counters
Restaurant menu problem
Practice problems often involve real-life scenarios like choosing from a restaurant menu. You need to list all possible combinations (like main course and dessert pairs) and then calculate the probability of specific combinations occurring.
Key Points to Remember:
- Frequency trees help you organise data about multiple events using the golden rule
- The golden rule states that each frequency equals the sum of its branches
- Sample space diagrams show all possible outcomes when two events happen together
- Complementary probabilities always add up to 1 (if , then )
- These tools are essential for solving complex probability problems involving multiple events