Venn diagrams (AQA GCSE Maths): Revision Notes
Venn diagrams
What are Venn diagrams?
A Venn diagram is a visual tool used to display frequencies and relationships in probability questions. These diagrams help us organise data when dealing with two or more groups that may have some overlap.
Venn diagrams are particularly powerful because they transform complex probability problems into clear visual representations, making it easier to see relationships between different groups and calculate accurate probabilities.
The basic structure consists of:
- A rectangle that represents everyone in the survey or study
- Circles (usually two) that represent different groups or categories
- Numbers in each section showing how many people belong to that category
Understanding the sections
When you look at a Venn diagram, each area tells you something specific about the relationships between groups.
Section Meanings:
- Left circle only: People who belong to the first group but not the second
- Right circle only: People who belong to the second group but not the first
- Overlapping section: People who belong to both groups
- Outside both circles: People who don't belong to either group
The total of all sections should equal the total number of people surveyed.
Important set notation
Understanding set notation is essential for GCSE exams and helps you communicate mathematical relationships clearly.
Key Symbols You Must Know:
- ∩ (intersection): This means "and" - the overlap between two groups
- ∪ (union): This means "or" - everything in either group (or both)
- ' (complement): This means "not" - everything outside a particular group
For example, if D represents dog owners and C represents cat owners:
- D ∩ C = people who own both a dog and a cat
- D ∪ C = people who own a dog or a cat (or both)
- D' = people who do not own a dog
Working through an example
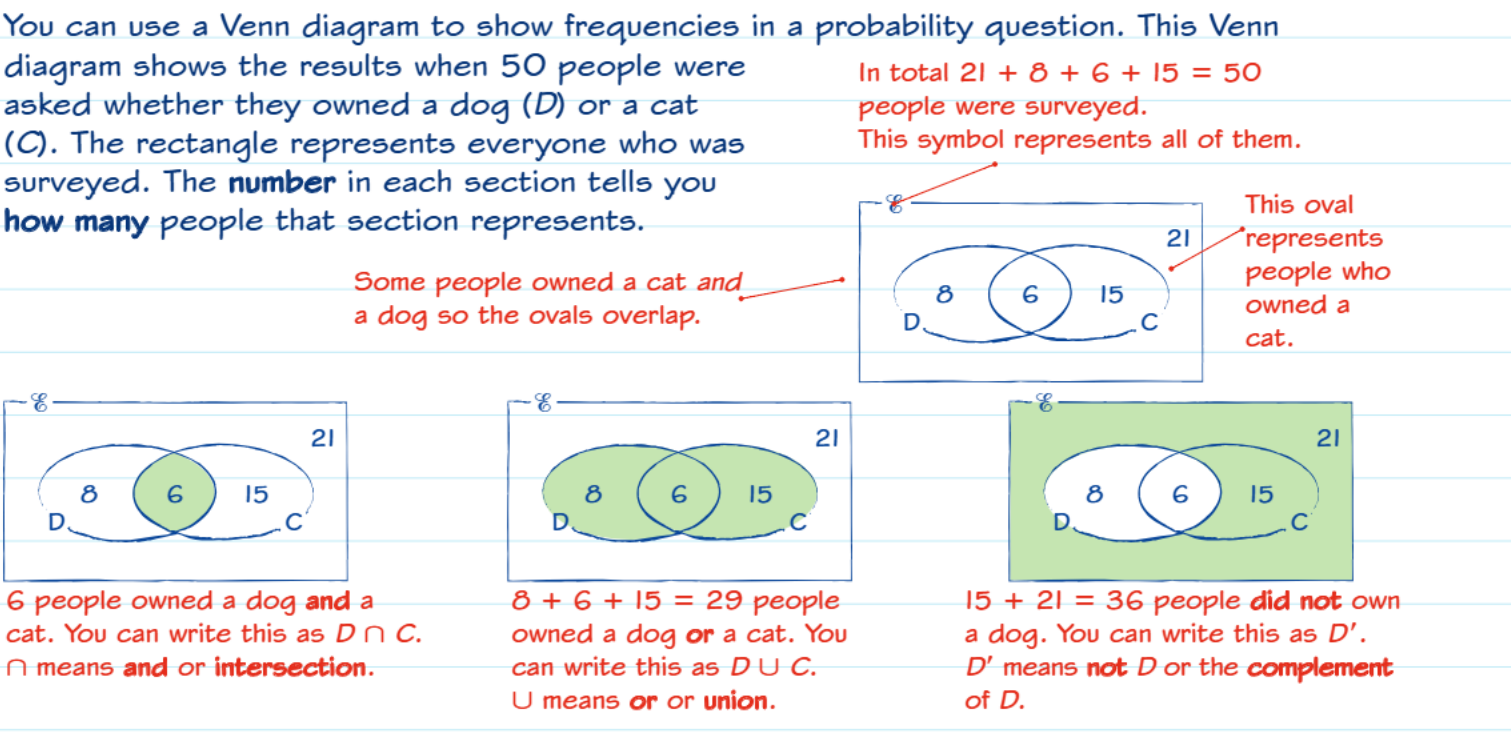
Let's examine a survey about pet ownership where 50 people were asked about dogs and cats:
Worked Example: Pet Ownership Survey
Step 1: Start with the overlap
- 6 people owned both a dog and a cat
- This number goes in the middle section
Step 2: Calculate the remaining sections
- 8 people owned only a dog (left section)
- 15 people owned only a cat (right section)
- 21 people owned neither pet (outside both circles)
Step 3: Check your work
- Total = 8 + 6 + 15 + 21 = 50 ✓
Calculating probabilities
Once you have completed your Venn diagram, you can calculate probabilities using the fundamental formula:
Using the pet ownership example above, we can calculate several probabilities:
- Probability of owning a dog =
- Probability of owning both pets =
- Probability of owning neither =
Worked example: Sports survey
36 members of a youth club were surveyed about tennis and football:
- 19 played tennis
- 14 played football
- 6 played both sports
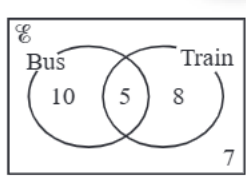
Worked Example: Youth Club Sports Survey
Solution process:
- Put 6 in the overlap (both sports) - always start here
- Tennis only = 19 - 6 = 13 people
- Football only = 14 - 6 = 8 people
- Neither sport = 36 - 13 - 6 - 8 = 9 people
Probability calculation: If one member is chosen at random, the probability they play neither sport =
Common Mistake to Avoid: Never forget to subtract the overlap when calculating "only" categories. For example, "tennis only" is NOT the total number playing tennis - you must subtract those who play both sports.
Exam tips
Essential Exam Strategies:
- Always start by filling in the overlap first - this prevents calculation errors
- Work systematically through each section following a consistent order
- Check your totals add up to the survey size before moving to probability calculations
- Show all working clearly for full marks - examiners need to see your method
- Remember to simplify fractions in probability answers where possible
Key Points to Remember:
- Venn diagrams organise data visually to show relationships between groups
- The overlap represents people in both categories - always start here
- Set notation: ∩ means "and", ∪ means "or", ' means "not"
- Check totals - all sections should add up to the total surveyed
- Probability = favourable outcomes ÷ total outcomes