Frequency Tables — Finding Averages (AQA GCSE Maths): Revision Notes
Frequency tables — Finding averages
What are frequency tables?
A frequency table is simply a way of organising data that shows how many items fall into each category. The word frequency means "how many", so these tables tell us how many times each value appears in our data set. You might recognise this as similar to finding averages from lists, but now the data is organised in a helpful table format.
Frequency tables are particularly useful when dealing with large datasets because they organise information in a clear, structured way that makes calculations much easier than working with raw data lists.
The four key rules for finding averages
When working with frequency tables, there are four important rules to remember for finding different types of averages:
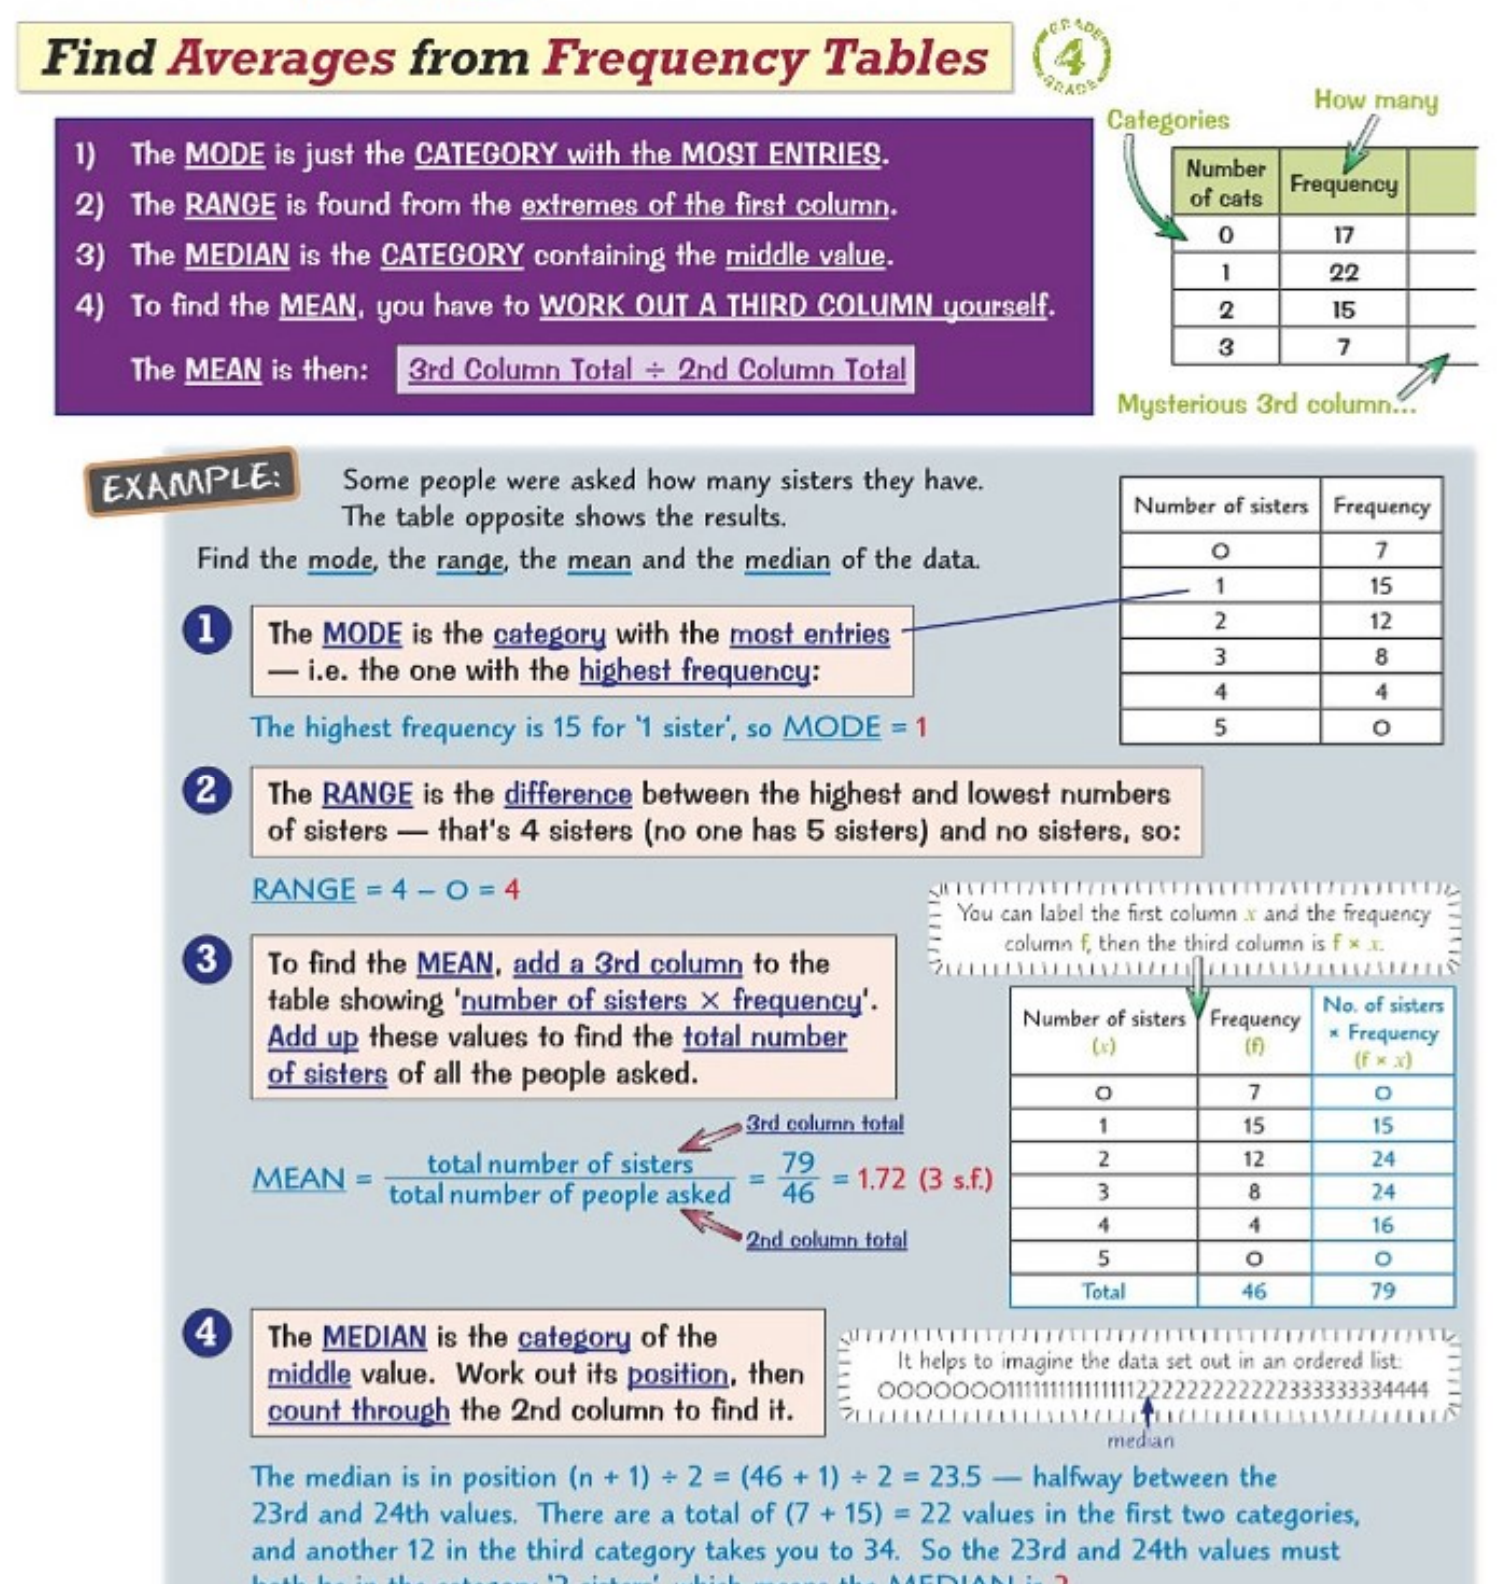
- Mode: This is simply the category that appears most frequently (has the highest frequency count)
- Range: This is calculated using the extreme values from the first column of your table
- Median: This is the category that contains the middle value when all data points are arranged in order
- Mean: This requires you to create an additional column and perform calculations
These four types of averages each tell us something different about our data. The mode shows the most common value, the range shows the spread, the median shows the middle position, and the mean shows the overall average.
Finding the mode
The mode is the easiest average to find from a frequency table. You simply need to look at the frequency column and identify which category has the largest number. This category with the most entries is your mode.
Worked Example: Finding the Mode
If you have data about the number of sisters people have, and the frequency for "1 sister" is 15 (the highest frequency), then the mode would be 1 sister.
Simply look down the frequency column and find the highest number - the corresponding category is your mode.
Finding the range
To find the range, you need to look at the first column of your frequency table, which contains the categories or values. The range is the difference between the highest and lowest values in this column.
Worked Example: Finding the Range
Using the sisters example, if the data goes from 0 sisters to 4 sisters, the range would be: Range = 4 - 0 = 4
Remember that the range only uses the extreme values from the first column - you don't need to look at the frequency column at all for this calculation.
Finding the mean
Finding the mean from a frequency table requires more work than the other averages. You need to create a third column that multiplies each value by its frequency. This gives you the total contribution of each category to the overall sum.
 The process works like this:
- Create a third column showing "value × frequency" for each row
- Add up all the values in this third column to get the total
- Add up all the frequencies (second column) to get the total number of data points
- Divide the third column total by the second column total
The formula becomes: Mean =
Common Mistake to Avoid: Always double-check your third column calculations when finding the mean - this is where most errors occur. Make sure you're multiplying each value by its frequency correctly.
Finding the median
The median represents the middle value when all data points are arranged in order. With frequency tables, you need to find the position of the median first, then work out which category contains that position.
To find the median position, use the formula: , where is the total number of data points.
Once you know the position, count through the frequency column until you reach that position. The category where this position falls is your median.
Worked Example: Finding the Median
If you have 46 people surveyed, the median position would be:
This means you need to find the value that's halfway between the 23rd and 24th values when arranged in order.
Practice with real data
| Number of of tme sport played | Frequency |
|---|---|
| 0 | 8 |
| 1 | 15 |
| 2 | 17 |
| 3 | 6 |
| 4 | 4 |
| 5 or more |
Understanding these methods becomes much clearer when you work through examples systematically. The key is to take each step slowly and double-check your arithmetic, especially when creating the third column for the mean calculation.
Working through practice problems is essential for mastering frequency table calculations. Start with simple examples and gradually work up to more complex datasets.
Remember!
Key Points to Remember:
- Mode = The category with the highest frequency - just look for the biggest number in the frequency column
- Range = Highest value minus lowest value from the first column
- Mean = Create a third column (value × frequency), then divide column 3 total by column 2 total
- Median = Find the middle position using , then count through frequencies to locate it
- Always double-check your third column calculations when finding the mean - this is where most errors occur