Sets and Venn Diagrams (AQA GCSE Maths): Revision Notes
Sets and Venn diagrams
What are sets?
A set is simply a collection of items or objects, which we call elements. Think of it like a group or category that contains specific things. For example, you might have a set of your favourite colours, a set of even numbers, or a set of students in your class.
Sets are always written using curly brackets { }. This is the standard mathematical notation that distinguishes sets from other mathematical objects.
Here are some examples:
- - the set of even numbers from 2 to 10
- - a set of colours
- - this means "the set of all x where x is a prime number less than 10"
When we want to talk about how many elements are in a set, we use the notation . This simply means "the number of elements in set A". So if set , then .
Worked Example: Finding the Number of Elements
If set , then because there are 5 days of the week in this set.
Understanding Venn diagrams
Venn diagrams are a brilliant visual way to represent sets and show the relationships between them. They use circles to represent different sets, and these circles can overlap to show when elements belong to multiple sets.
 The diagram above shows the key components you need to understand:
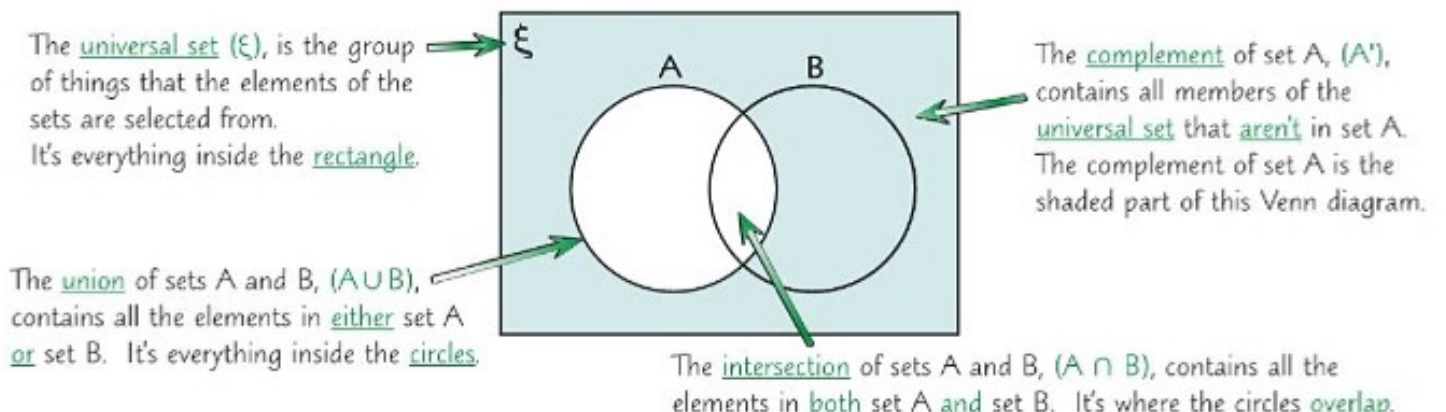
The universal set (ξ)
This is represented by the rectangle that contains everything. The universal set includes all possible elements that we're considering for our particular problem. It's like the "universe" from which we select our sets.
Union of sets (A∪B)
The union combines all elements that are in either set A or set B (or both). It's everything that falls within either circle. Think of it as "A or B or both".
The union symbol can be read as "A union B" or "A or B or both".
Intersection of sets (A∩B)
The intersection contains only the elements that are in both set A and set B. This is shown by the overlapping area where the circles cross over. Think of it as "A and B together".
Complement of set A (A')
The complement includes all elements in the universal set that are not in set A. It's everything outside circle A but still within the universal set rectangle.
Remember that the complement only includes elements from the universal set that are not in set . It doesn't include elements from outside the universal set.
Calculating probabilities from Venn diagrams
Venn diagrams are extremely useful for solving probability problems because they help us visualise the data clearly. Let's work through a practical example to see how this works.
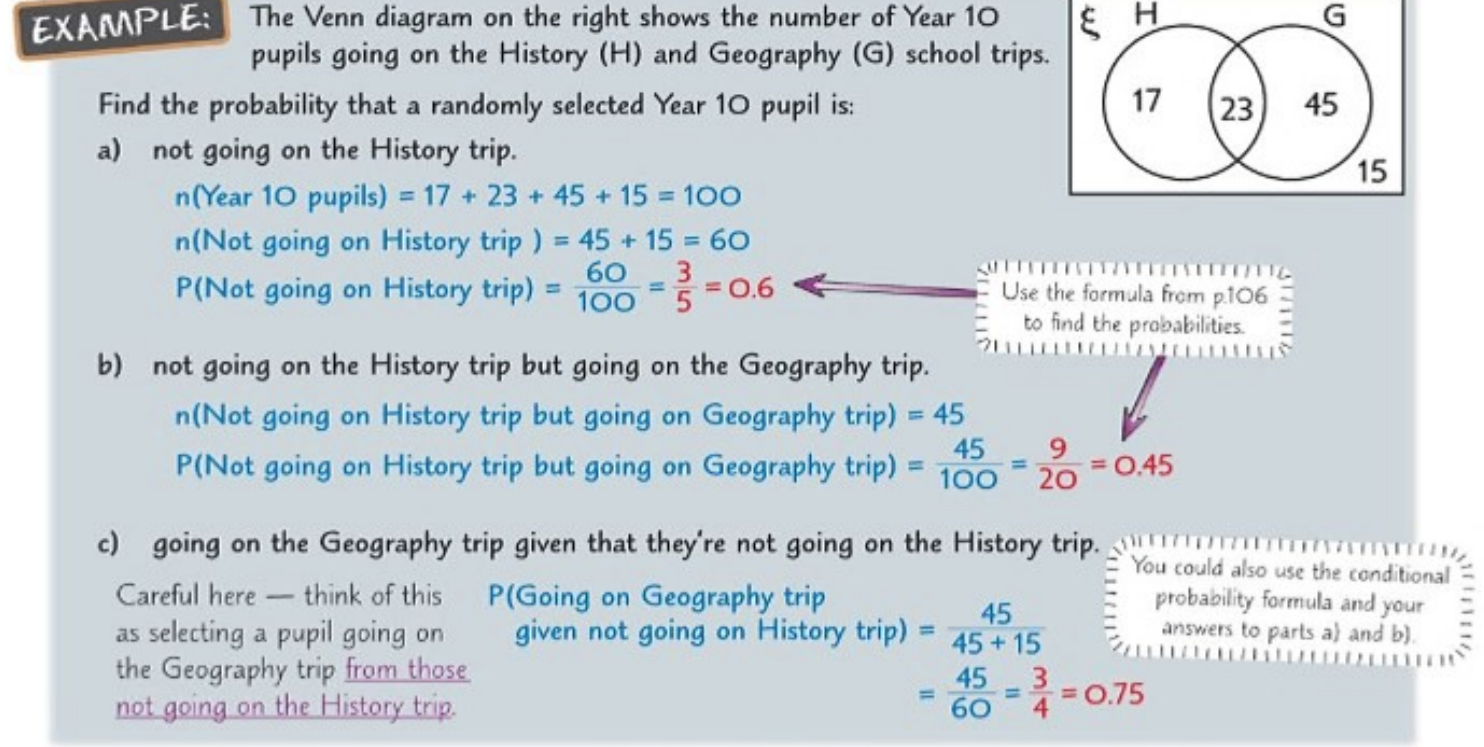 In this example, we have 100 Year 10 students, and we want to find probabilities about their school trip choices. The Venn diagram shows:
- 17 students going only on the History trip
- 23 students going on both trips
- 45 students going only on the Geography trip
- 15 students going on neither trip
Finding basic probabilities
Worked Example: Probability of not going on the History trip
To find this, we need to count all students who are not in the History circle. This includes:
- Students going only on Geography: 45
- Students going on neither trip: 15
- Total not going on History: 45 + 15 = 60
Therefore:
Worked Example: Not going on History but going on Geography
This is simply the students in the Geography circle but not in the History circle:
Worked Example: Conditional probability
This asks: "Given that a student is not going on the History trip, what's the probability they're going on the Geography trip?"
From those not going on History (60 students), 45 are going on Geography.
Working with Venn diagram problems
When solving Venn diagram problems, follow these essential steps:
- Identify the universal set - what's the total number of items/people being considered?
- Label each region - work out the numbers for each section of the diagram, including overlaps
- Check your work - make sure all regions add up to the total
- Calculate probabilities - use the formula:
For conditional probability problems, remember that you're now working with a reduced sample space. If you're told "given that..." then your total is no longer the universal set, but rather the specific condition mentioned.
Always double-check that the numbers in all regions of your Venn diagram add up to the total number in the universal set. This is a quick way to catch errors early.
Practice makes perfect
The best way to master Venn diagrams is through practice. Try drawing your own diagrams when solving problems, and always double-check that your regions add up correctly. Remember that probability values should always be between 0 and 1, and percentages should be between 0% and 100%.
When drawing Venn diagrams, start with the intersection (overlap) first, then work outwards to the individual regions. This helps prevent calculation errors.
Remember!
Key Points to Remember:
- Sets are collections of elements, always written in curly brackets
- Venn diagrams use overlapping circles to show relationships between sets visually
- The universal set contains all possible elements we're considering
- Union means "A or B or both", intersection means "A and B together"
- Always check that the numbers in all regions of your Venn diagram add up to the total
- For conditional probability, your denominator changes to reflect the given condition