Tree Diagrams (AQA GCSE Maths): Revision Notes
Tree diagrams
Tree diagrams are powerful visual tools that help you calculate probabilities when dealing with combinations of events. They provide a systematic way to organise and solve probability problems by showing all possible outcomes and their associated probabilities.
Understanding tree diagrams
Tree diagrams work by representing each stage of a probability experiment as branches on a tree. Each branch shows the probability of a particular outcome occurring, and you can follow the branches from left to right to see the complete sequence of events.
The beauty of tree diagrams lies in their ability to break down complex probability problems into manageable steps. Whether you're dealing with independent events, dependent events, or conditional probabilities, tree diagrams provide a clear visual framework for your calculations.
Tree diagrams are particularly useful because they force you to think systematically about each stage of a probability experiment. This structured approach helps prevent common mistakes and ensures you don't miss any possible outcomes.
Four essential tree diagram rules
When working with tree diagrams, there are four fundamental rules that you must always remember. These rules form the foundation of all tree diagram calculations and will help you avoid common mistakes.
The Four Essential Tree Diagram Rules:
-
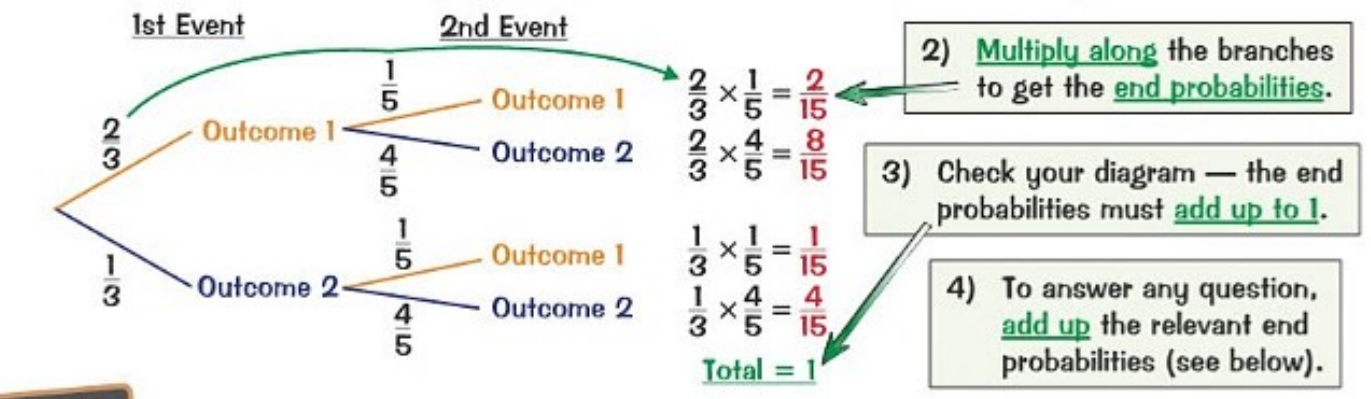
Addition Rule at Branch Points: On any set of branches that meet at a point, the probabilities must add up to 1. This makes perfect sense because these branches represent all possible outcomes for that stage of the experiment, and something must happen.
-
Multiplication Rule Along Branches: Calculate end probabilities by multiplying along the branches. To find the probability of any specific sequence of outcomes, you multiply the probabilities of each individual event in that sequence.
-
Verification Rule: Check your work by ensuring that all end probabilities add up to 1. This serves as a valuable verification step and helps you catch any calculation errors.
-
Addition Rule for Final Answers: Answer probability questions by adding up the relevant end probabilities. Many questions will ask for the probability of several different outcomes combined, so you need to identify all the relevant paths and sum their probabilities.
Working with replacement scenarios
Let's explore how tree diagrams work with a practical example involving replacement. When items are replaced between selections, each draw is independent, meaning the probability remains the same for each stage.
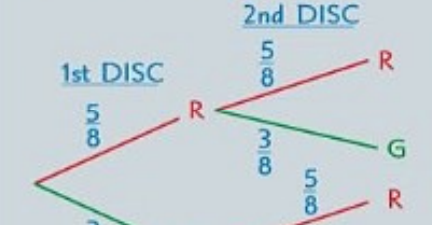
Consider a box containing 5 red discs and 3 green discs. When one disc is taken at random, its colour is noted, and then it's replaced before taking a second disc. The probability of selecting a red disc remains for both draws, and the probability of selecting a green disc remains for both draws.
Worked Example: Same Colour Discs
To find the probability that both discs are the same colour, you need to consider two scenarios: both red or both green.
Step 1: Calculate probability of both red
Step 2: Calculate probability of both green
Step 3: Add the probabilities (since these are mutually exclusive events)
This demonstrates both the multiplication rule for individual outcomes and the addition rule for combining mutually exclusive events.
Tackling "at least" questions
"At least" questions can initially seem challenging, but there's a clever strategy that makes them much easier to solve. Instead of calculating the probability of "at least" a certain number directly, it's often simpler to calculate the probability of "less than" that number and subtract from 1.
This approach works because "at least one" is the complement of "none," and probabilities of complementary events always sum to 1.
Worked Example: Rolling At Least One Six
If you want to find the probability of rolling at least one six when rolling three fair dice, you can calculate the probability of rolling no sixes and subtract from 1.
Step 1: Find probability of not rolling a six on one die
Step 2: Find probability of no sixes on all three dice
Step 3: Use complement rule
This complement approach is particularly useful when dealing with "at least" questions because it often involves fewer calculations and reduces the chance of making errors. Remember: at least = 1 minus less than
Building confidence with tree diagrams
Tree diagrams become much easier with practice, and understanding the logic behind each step will help you tackle even complex probability problems. Remember that tree diagrams are simply visual representations of the multiplication and addition rules of probability.
When constructing your own tree diagrams, always start by identifying the stages of your experiment and the possible outcomes at each stage. Write the probabilities clearly on each branch, and make sure they add up to 1 at each branching point.
Construction Tips:
- Take your time when multiplying along branches and adding end probabilities
- Double-check your arithmetic at each step
- Use the fact that all end probabilities must sum to 1 as a verification tool
- Start with simple examples before moving to complex problems
With consistent practice, you'll find that tree diagrams become an invaluable tool for solving probability problems efficiently and accurately.
Key Points to Remember:
- Tree diagrams help you visualise and calculate probabilities for combinations of events by showing all possible outcomes and their probabilities
- Always ensure that probabilities on branches meeting at a point add up to 1, multiply along branches for end probabilities, and check that all end probabilities sum to 1
- For "at least" questions, use the complement rule by calculating 1 minus the probability of "less than" that number - this is usually much easier than direct calculation
- When items are replaced between selections, each draw is independent with the same probabilities throughout the experiment
- Tree diagrams work by applying the multiplication rule for individual sequences and the addition rule for combining different outcomes that satisfy your question