Two-way tables (AQA GCSE Statistics): Revision Notes
Two-way tables
Two-way tables are an excellent tool for organising data that involves two different categories or variables. These tables help us see patterns in data and calculate probabilities in real-world situations. Understanding how to work with two-way tables is essential for GCSE probability questions.
What are two-way tables?
A two-way table (also called a contingency table) displays data organised by two different categories. The data is arranged in rows and columns, with one category forming the rows and the other forming the columns. Each cell in the table shows the frequency (number of occurrences) for that particular combination of categories.
Two-way tables are particularly useful because they allow us to examine relationships between two variables simultaneously, making it easier to spot trends and calculate conditional probabilities.
The table always includes:
- Row totals (sum of each row)
- Column totals (sum of each column)
- Grand total (total number of data points)
Reading and interpreting two-way tables
Let's examine how to read a two-way table using a practical example about sandwich preferences:
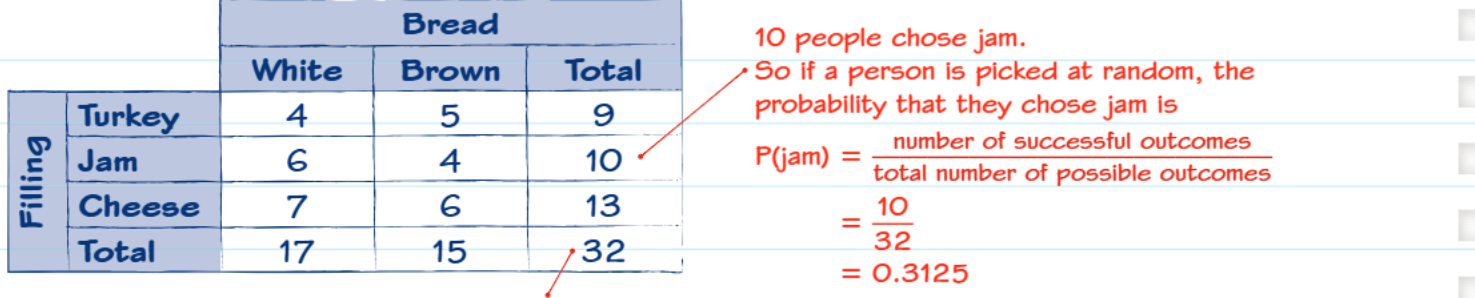
In this sandwich preference table, we can see:
- The rows represent different filling types (Turkey, Jam, Cheese)
- The columns represent bread types (White, Brown)
- Each cell shows how many people chose that combination
- The totals help us verify our data is complete
For instance, 4 people chose turkey sandwiches with white bread, whilst 5 people chose turkey with brown bread, giving us a total of 9 people who chose turkey sandwiches.
Calculating probabilities from two-way tables
The key formula for calculating probability from a two-way table is:
This fundamental probability formula is the foundation for all calculations involving two-way tables. Make sure you can identify both parts clearly before attempting any calculation.
Step-by-step method
- Identify what you're looking for - This becomes your "successful outcomes"
- Find the relevant number in the table - Look in the appropriate cell or total
- Find the total number of outcomes - Usually the grand total
- Calculate the probability - Divide successful outcomes by total outcomes
- Simplify if possible - Convert to a decimal or simplest fraction
Worked examples
Worked Example 1: Basic probability calculation
Using the sandwich table, let's find the probability that a randomly selected person chose jam.
Step 1: We want , so successful outcomes = people who chose jam Step 2: From the table, 10 people chose jam (row total) Step 3: Total number of people = 32 (grand total) Step 4:
Worked Example 2: More complex probability calculations
Let's look at a garage services example:
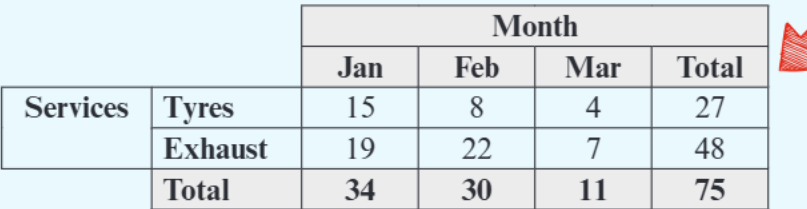
Question: What's the probability a randomly selected service was done in February?
Solution:
- Successful outcomes = services done in February = 30
- Total outcomes = total services = 75
Question: What's the probability a service was tyres AND done in January?
Solution:
- Successful outcomes = tyre services in January = 15
- Total outcomes = 75
Common exam question types
Understanding the different types of questions you might encounter will help you approach two-way table problems with confidence.
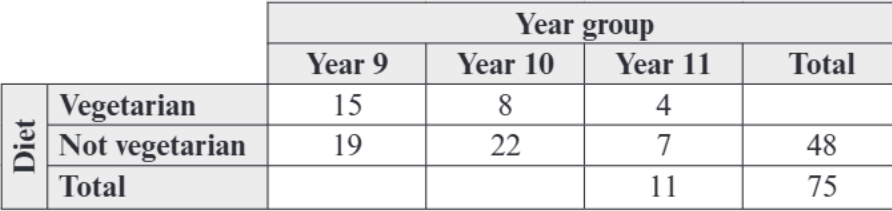
Completing tables
Sometimes you'll be given an incomplete two-way table and asked to fill in missing values. Remember that:
- Row totals must equal the sum of that row
- Column totals must equal the sum of that column
- The grand total equals the sum of all row totals (or all column totals)
When completing tables, work systematically through the missing values. Often, finding one missing value will help you calculate others. Always double-check that your totals are consistent.
Finding most likely outcomes
When asked which outcome is most likely, look for the highest frequency in the relevant category. For example, if asking about the most likely service type, compare the row totals to find the highest.
Key exam tips
Essential Tips for Success:
- Always check your totals - Row and column totals should add up correctly
- Read questions carefully - Make sure you understand what probability you're calculating
- Simplify fractions - Give your final answer in its simplest form unless asked otherwise
- Use the correct total - Sometimes you need a row/column total, not the grand total
- Show your working - Write out the probability formula and substitute your values
Common mistakes to avoid
Watch Out for These Common Pitfalls:
- Using the wrong total (using grand total when you should use a row/column total)
- Misreading the table structure
- Forgetting to simplify fractions
- Not clearly identifying what constitutes a "successful outcome"
Remember!
Key Points to Remember:
- Two-way tables organise data using two categories arranged in rows and columns
- Always use the formula:
- Check that all totals add up correctly - this helps spot errors
- The most likely outcome is the one with the highest frequency
- Practice identifying which cell or total contains your "successful outcomes" before calculating