Ecology, Ecosystems, and Biodiversity (LC 2027) (Leaving Cert Biology): Revision Notes
Measuring Features of an Ecosystem
Species diversity index
A species diversity index is a mathematical tool that helps ecologists measure the variety of life in a community. It's much more sophisticated than simply counting the number of different species present. The index considers two crucial factors that together give us a complete picture of biodiversity:
- Species richness - the total number of different species in the community
- Relative abundance - how evenly the individual organisms are spread among the different species
Understanding species diversity is essential for assessing ecosystem health. An ecosystem where species have similar population sizes is generally more stable and diverse than one dominated by just a few species, even if both contain the same total number of species.
Species diversity indices are particularly valuable because they provide a single numerical value that captures both the variety and distribution of species in an ecosystem, making it easier to compare different habitats or track changes over time.
Simpson's diversity index equation
Simpson's diversity index is one of the most widely used methods for calculating species diversity. The mathematical formula may look complex at first, but it's quite logical:
Where:
- = Simpson's diversity index value
- = the number of individuals of each particular species
- = the total number of individuals of all species combined
- = sum of (you calculate for each species, then add them all together)
The resulting value of ranges between 0 and 1:
- 1 represents maximum possible diversity
- 0 represents no diversity at all
- Higher values indicate greater biodiversity
Understanding diversity through examples
Let's examine how this works using woodland data comparing two different forest areas:
Worked Example: Comparing Woodland Diversity
In Woodland A, each of the three tree species (X, Y, and Z) has exactly 6 individuals, creating an even distribution. In Woodland B, species X dominates with 12 individuals, while species Y and Z each have only 3 individuals.
Both woodlands have the same species richness (3 species) and the same total number of trees (18), yet their diversity calculations reveal important differences. Woodland A achieves a higher diversity index score because its species are more evenly distributed, while Woodland B's uneven distribution results in lower diversity despite having the same species present.
Practical applications of diversity indices
Species diversity indices serve many important purposes in ecological research and conservation:
- Habitat monitoring - tracking how biodiversity changes over time in response to environmental pressures
- Impact assessment - measuring how pollution, invasive species, or climate change affect local ecosystems
- Conservation decisions - providing scientific data to inform planning for new developments, road construction, or habitat protection projects
Population curves
Population curves are graphs that show how the number of individuals in a species changes over time. These patterns help ecologists understand population dynamics and predict future changes. There are two fundamental types of population growth that create distinctly different curve shapes.
J-shaped population curves
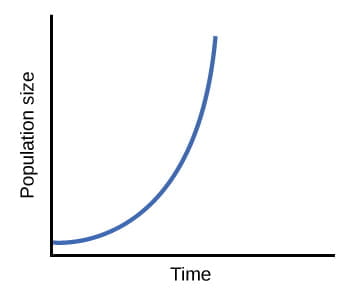
J-shaped curves represent exponential growth, where the population size increases at an ever-accelerating rate. This dramatic growth pattern occurs under specific conditions:
- Abundant resources with no apparent limits
- Ideal environmental conditions (temperature, pH, etc.)
- Absence of significant predators or diseases
- Unlimited space for expansion
Worked Example: Bacterial Exponential Growth
A classic example involves bacteria growing in laboratory conditions. When placed in a nutrient-rich environment, bacteria can double their population every 20 minutes. Starting with 1,000 individuals:
- After 20 minutes: 2,000 individuals
- After 40 minutes: 4,000 individuals
- After 60 minutes: 8,000 individuals
- This explosive expansion continues indefinitely under ideal conditions
However, exponential growth cannot continue indefinitely in natural environments. Eventually, limiting factors such as resource depletion, waste accumulation, or increased competition cause the population to crash dramatically.
S-shaped population curves
S-shaped curves demonstrate logistic growth, which more accurately reflects how most populations behave in nature. This growth pattern shows three distinct phases:
- Initial slow growth - the population is small and reproduction is limited
- Rapid exponential phase - conditions improve and the population expands quickly
- Levelling off phase - growth slows as environmental limits are reached
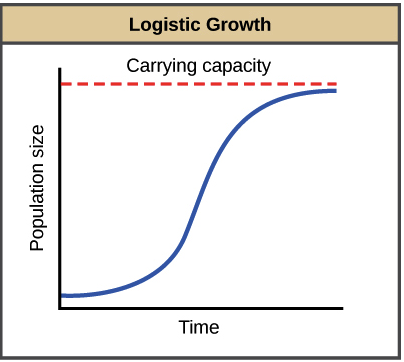
The horizontal dashed line in the diagram represents the carrying capacity - the maximum population size that the environment can sustain over the long term. As populations approach this limit, their growth rate naturally slows and eventually stabilises.
Carrying capacity and limiting factors
Carrying capacity is determined by various limiting factors that restrict how large a population can grow in a particular environment:
Limiting factors for plants include:
- Available sunlight for photosynthesis
- Water supply and soil moisture
- Essential soil nutrients and minerals
- Physical space for root systems and growth
Limiting factors for animals include:
- Food availability and quality
- Access to fresh water sources
- Suitable shelter and nesting sites
- Territory size requirements
- Availability of mating partners
When populations approach their carrying capacity, increased competition for these limited resources causes growth rates to decline and populations to stabilise around the maximum sustainable level.
Pyramids of numbers
Pyramids of numbers are visual diagrams that display the quantity of organisms present at each trophic level within a food chain. These diagrams help us understand how energy and nutrients flow through ecosystems by showing the numerical relationships between producers and consumers.
Shapes of number pyramids
Depending on the specific ecosystem characteristics, pyramids of numbers can take several different forms:
- Upright pyramids represent the most common pattern, where organism numbers decrease at each higher trophic level. This makes biological sense because many producers are needed to support fewer primary consumers, which in turn support even fewer secondary and tertiary consumers.
- Inverted pyramids occur when there are fewer organisms at the producer level than at consumer levels. This seemingly unusual pattern can happen when individual producers are very large (such as oak trees) and can support many smaller consumers (like insects and birds).
- Spindle-shaped pyramids have a narrow base and top but a broader middle section. This pattern appears when intermediate trophic levels contain more organisms than either the producers or top-level consumers.
Limitations of number pyramids
While pyramids of numbers provide useful information, they have several important limitations:
Key Limitations to Remember:
Size variations - The method doesn't account for dramatic differences in organism size. A single large tree may support thousands of small insects, creating a misleading inverted appearance even when biomass relationships are normal.
Counting challenges - Accurately counting certain organisms can be extremely difficult, particularly microscopic species, soil organisms, or animals that are nocturnal or well-hidden.
Seasonal changes - Population numbers often fluctuate dramatically throughout the year due to breeding cycles, migration, or seasonal food availability, making it challenging to represent the ecosystem accurately at any single point in time.
Pyramids of biomass
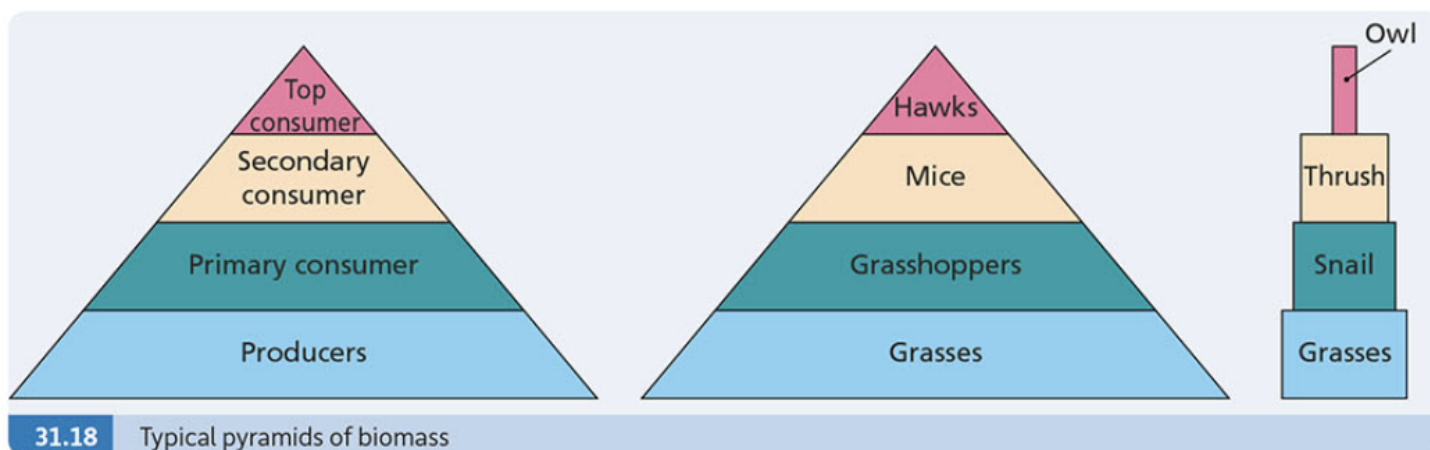
Biomass refers to the total mass of all living tissue in a given area. Pyramids of biomass show the total biomass present at each trophic level, providing a more accurate representation of energy relationships within ecosystems than simple organism counts.
Typical biomass pyramids
In most terrestrial ecosystems, biomass decreases as you move up through the trophic levels, creating the classic pyramid shape. This pattern occurs because:
- Approximately 90% of energy is lost between each trophic level through metabolic processes
- Large amounts of producer biomass are required to support smaller amounts of primary consumer biomass
- Each successive trophic level can sustain progressively less total biomass
This fundamental pattern reflects the one-way flow of energy through ecosystems, with most energy being converted to heat and lost during cellular respiration and other life processes.
Inverted biomass pyramids
In some ecosystems, particularly aquatic ones, pyramids of biomass can appear inverted or upside-down:
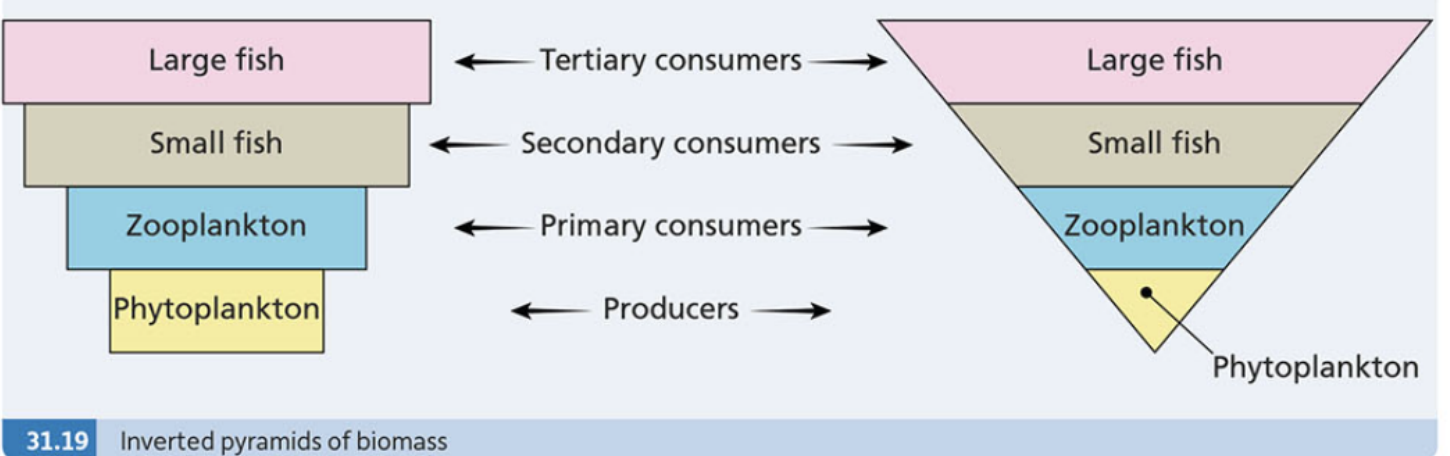
This occurs when:
- Rapid reproduction rates - producers like phytoplankton reproduce extremely quickly
- Short producer lifespans - producers are consumed rapidly but constantly replaced
- Long-lived consumers - organisms like fish accumulate biomass over extended periods while feeding continuously on fast-reproducing producers
Although the standing biomass of producers appears small at any given moment, their extremely high productivity rates enable them to support the larger biomass of longer-lived consumers.
Comparing measurement approaches
Each measurement method offers distinct advantages and faces specific challenges:
Key Comparison Points:
Pyramids of numbers:
- Advantages: Counting individual organisms is generally easier than measuring their biomass
- Disadvantages: Fails to account for significant size differences between organisms
Pyramids of biomass:
- Advantages: Provides more accurate representation by considering organism size and mass
- Disadvantages: Difficult to obtain accurate biomass measurements, particularly without harming living organisms
Understanding these trade-offs helps researchers choose the most appropriate measurement technique based on their specific research objectives and available resources.
Remember!
Key Points to Remember:
- Species diversity indices combine both species richness and evenness to provide a single, comprehensive measure of biodiversity
- J-shaped curves show unlimited exponential growth, while S-shaped curves demonstrate realistic logistic growth that stabilises at carrying capacity
- Carrying capacity is determined by limiting factors including food availability, water access, shelter, and space requirements
- Pyramids of numbers display organism quantities but ignore size differences, while pyramids of biomass offer more accurate energy relationship representations
- Inverted pyramids can occur when producers are exceptionally large (numbers) or reproduce extremely rapidly (biomass), especially in aquatic ecosystems