Indicators and Titration Curves (Leaving Cert Chemistry): Revision Notes
Indicators and Titration Curves
Indicators
What are Acid-Base Indicators?
An acid-base indicator is a substance, usually a weak acid or weak base, that changes colour depending on the pH of the solution.
Indicators help identify the endpoint of a titration by visibly showing when neutralisation has occurred.
- In acidic conditions, an indicator exists predominantly in its protonated form (often a different colour).
- In basic conditions, the deprotonated form becomes more common, causing a colour change.
Common Indicators
| Indicator | Colour in Acid | Colour in Base | pH Range | Suitable For |
|---|---|---|---|---|
| Litmus | Red | Blue | 5 • 8 | Strong acid/strong base |
| Methyl orange | Red | Yellow | 3 • 5 | Strong acid/weak base |
| Phenolphthalein | Colourless | Pink | 8 • 10 | Weak acid/strong base |
How Indicators Work: The Theory
Indicators function through the reversible dissociation of a weak acid or weak base.
For a weak acid indicator ():
- (the undissociated form) and (the conjugate base) have different colours.
- The colour change depends on the relative concentrations of these two species, which is influenced by the pH of the solution.
Example: Litmus as an Indicator
- In acidic solutions: dominates, and the solution appears red.
- In basic solutions: dominates, and the solution appears blue.
Le Chatelier's Principle in Indicators
If an acid is added:
increases, pushing the equilibrium to the left, resulting in more , so the solution appears the colour of the acid form.
If a base is added:
reacts with , decreasing , shifting the equilibrium right, producing more , which causes the base colour to dominate.
Choosing the Right Indicator
To choose a suitable indicator for a titration, the following must be considered:
- The pH at the endpoint of the titration.
- The pH range over which the indicator changes colour. The indicator must change colour sharply at the equivalence point, where neutralisation occurs.
Titration Curves
A titration curve shows how the pH of a solution changes as a titrant (e.g., acid or base) is added.
The shape of the curve depends on the strength of the acid and base involved in the titration.
Key Features of Titration Curves
- Initial pH: The starting pH before any titrant is added.
- Equivalence Point: Where equal amounts of acid and base have reacted. The pH at this point varies depending on the acid and base's strength.
- Buffer Region: A section of the curve where pH changes more gradually.
- Steep Slope: Indicates the rapid pH change near the endpoint.
Types of Titrations
Strong Acid vs. Strong Base
Example: and
- The pH changes dramatically at the equivalence point, often from ~3 to ~10.
- Any indicator that changes colour around pH 7, like litmus or phenolphthalein, is suitable.
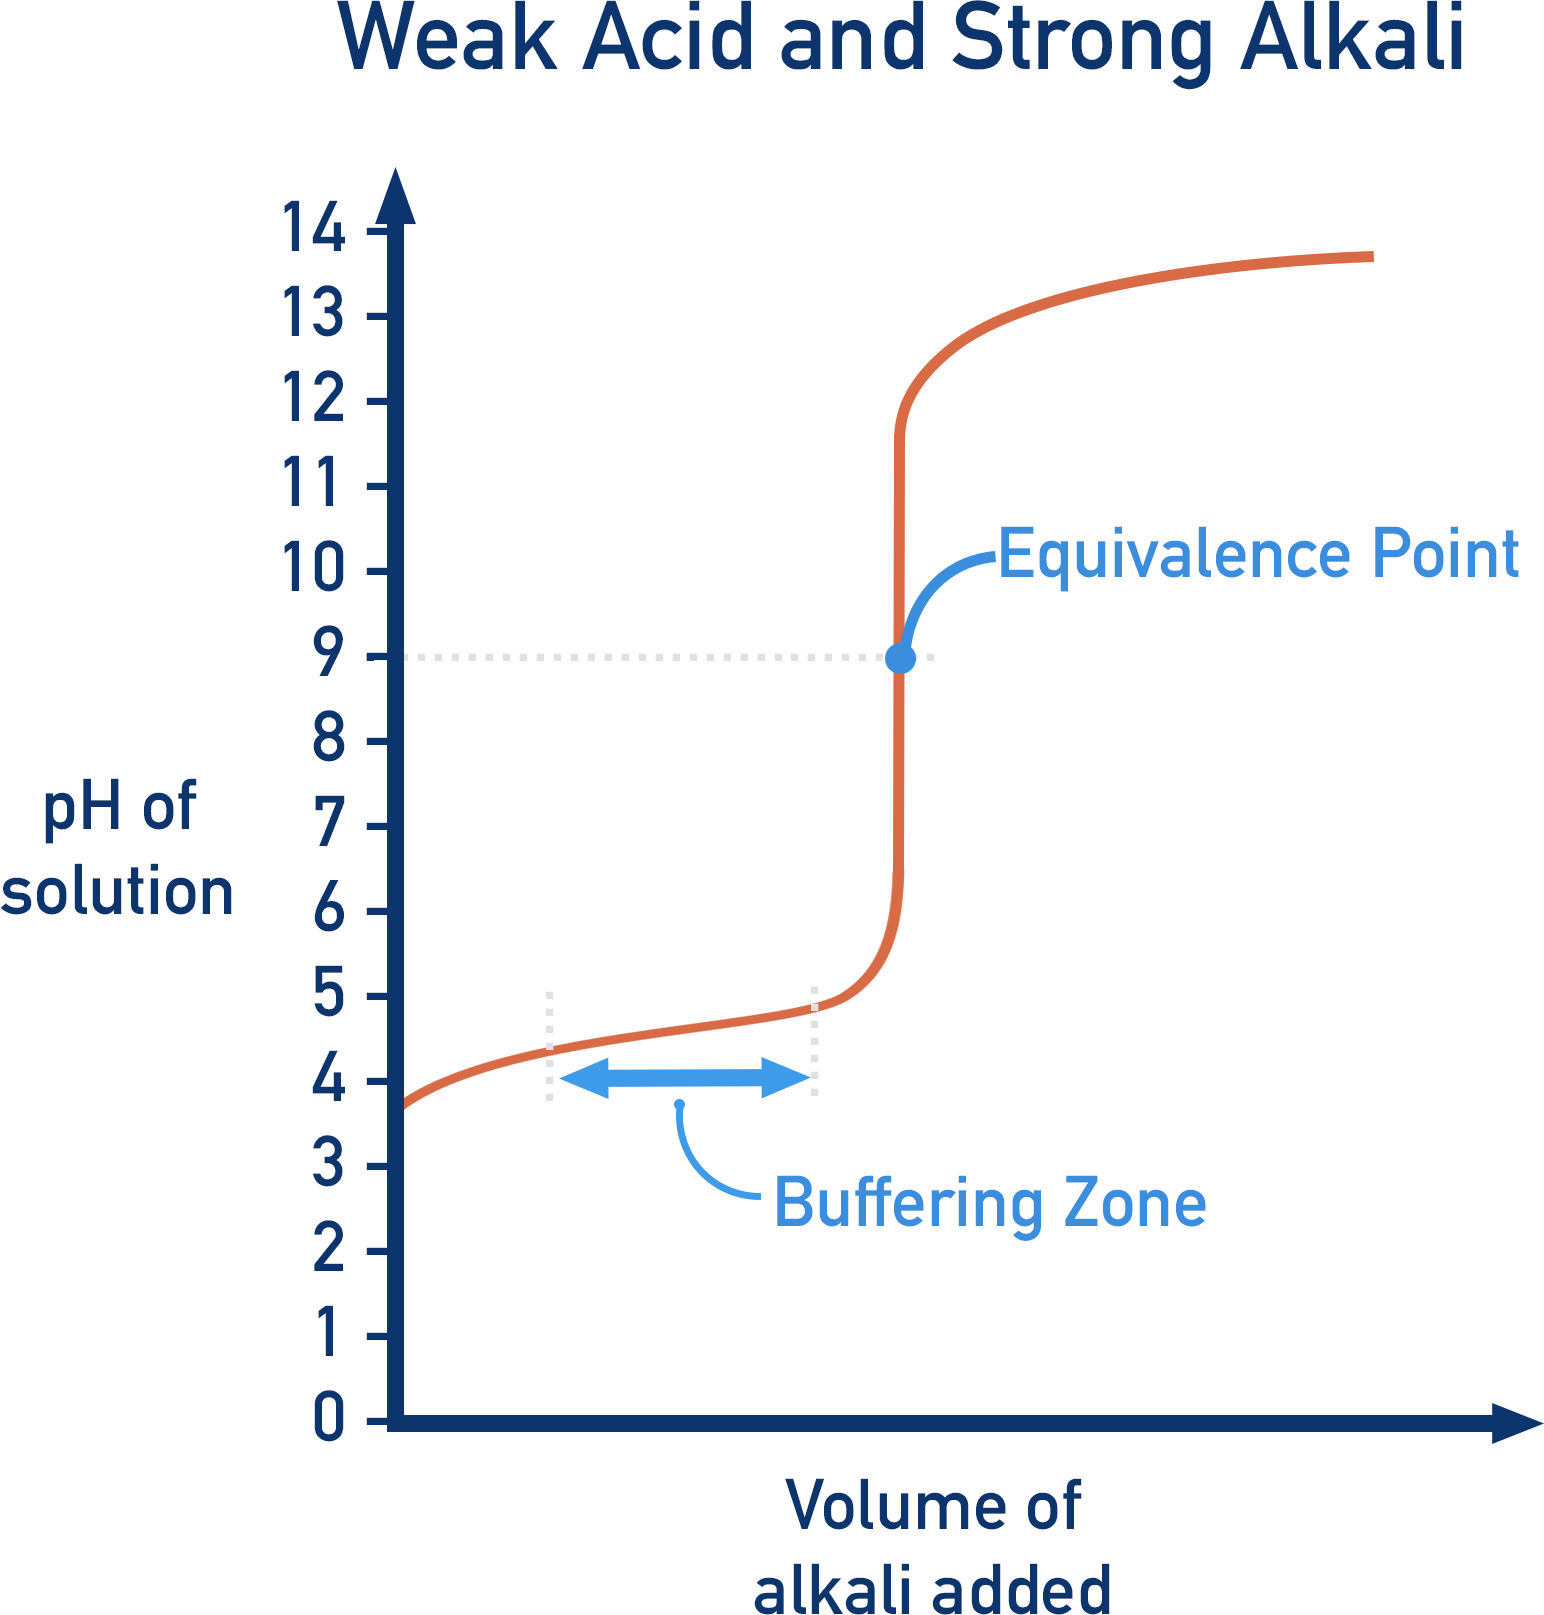
Weak Acid vs. Strong Base
Example: Ethanoic acid () and sodium hydroxide ()
- The equivalence point occurs in the basic range, typically between pH 8 to 10.
- Suitable indicator: Phenolphthalein, which changes colour around pH 8-10.
Strong Acid vs. Weak Base
Example: Hydrochloric acid () and sodium carbonate ()
- The pH at the equivalence point is slightly acidic, around pH 3-7.
- Suitable indicator: Methyl orange, as it changes colour in the pH range of 3-5.
Weak Acid vs. Weak Base
Example: Ethanoic acid and sodium carbonate There is no sharp change in pH at the equivalence point, making it difficult to choose an indicator.
No suitable indicator exists for this titration.
Key Points for Exam Preparation
- Indicators: Change colour in response to pH changes; each has a specific pH range where the colour change occurs.
- Choice of Indicator: Depends on the pH at the equivalence point of the titration.
- Titration Curves: Show how pH changes as titrant is added; the equivalence point is where neutralisation is complete.