Graphing Lines (Leaving Cert Mathematics): Revision Notes
Graphing Lines
When graphing linear equations on a coordinate plane, you need to understand several key methods and concepts that will help you accurately plot and identify lines. This is a fundamental skill in coordinate geometry that appears frequently in exam questions.
Finding two points to graph a line
To accurately graph any linear equation, you need to identify at least two points that lie on the line. The most efficient approach is to find the x-intercept and y-intercept of the line.
The intercept method
X-intercept: The point where the line crosses the x-axis (where ) Y-intercept: The point where the line crosses the y-axis (where )
Let's work through this process with the equation :
Worked Example: Finding Intercepts
Step 1: Find the y-intercept Set and solve for :
So the y-intercept is (0, 2).
Step 2: Find the x-intercept
Set and solve for :
So the x-intercept is (3, 0).
Once you have these two points, you can draw a straight line through them to complete your graph.
Lines parallel to the axes
Certain types of linear equations create lines that run parallel to either the x-axis or y-axis. These follow specific patterns that are important to recognise.
Vertical lines
Vertical lines have equations of the form , where 'a' is a constant number.
Key characteristics of vertical lines:
- All points on the line have the same x-coordinate
- The line runs straight up and down
- These lines are parallel to the y-axis
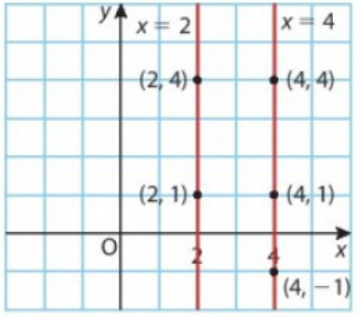
For example, the line contains points like , , and . Notice how the x-value remains constant at 2.
Horizontal lines
Horizontal lines have equations of the form , where 'b' is a constant number.
Key characteristics of horizontal lines:
- All points on the line have the same y-coordinate
- The line runs straight left and right
- These lines are parallel to the x-axis
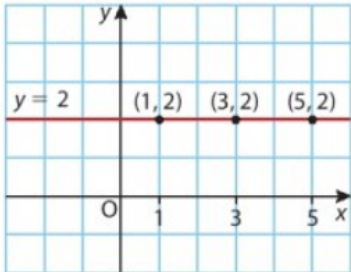
For example, the line contains points like , , and . The y-value stays constant at 2.
Lines containing the origin
When a linear equation has no constant term (like ), the line always passes through the origin at point .
To graph such lines:
- Note that is automatically one point on the line
- Choose any value for x and calculate the corresponding y-value to find a second point
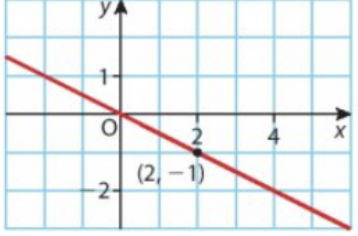
Worked Example: Line Through Origin
For the line :
- We know is on the line
- Let : , so
- The second point is (2, -1)
Verifying that a point lies on a line
To check whether a specific point lies on a given line, substitute the coordinates into the equation. If the equation holds true, the point is on the line.
Rule: If a point is on a line, then the coordinates of the point will satisfy the equation of the line.
Worked Example 1: Point Verification
Check if point lies on the line .
Solution: Substitute and : ✓
Since the equation equals 0, point is on the line.
Worked Example 2: Finding Unknown Coordinate
Find the value of if point lies on the line .
Solution: Substitute and :
Therefore, , making the point (2, 3).
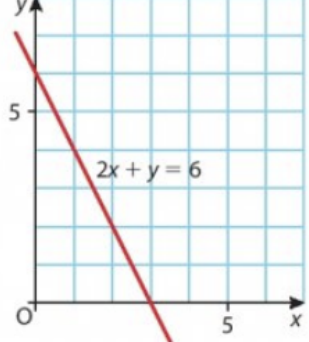
Worked Example 3: Graphing Using Intercept Method
Graph the line using the intercept method.
Solution: Step 1: Find y-intercept (set ) Y-intercept: (0, 6)
Step 2: Find x-intercept (set )
X-intercept: (3, 0)
Step 3: Plot points and , then draw the line through them.
Exam Tips
- Always find two points minimum when graphing a line
- The intercept method is usually the fastest approach
- Remember: vertical lines have equation constant, horizontal lines have constant
- When checking if a point lies on a line, substitute carefully and double-check your arithmetic
- Lines through the origin always have no constant term in their equation
Key Points to Remember:
-
To graph any line: Find the x-intercept (set ) and y-intercept (set ), then draw a straight line through these two points
-
Vertical lines: Have equation constant and are parallel to the y-axis
-
Horizontal lines: Have equation constant and are parallel to the x-axis
-
Lines through origin: Have no constant term and always pass through
-
Point verification: Substitute coordinates into the equation - if it balances, the point lies on the line