Tree Diagrams (Leaving Cert Mathematics): Revision Notes
Tree Diagrams
What are tree diagrams?
A tree diagram is a visual tool used to show all possible outcomes when two or more events occur in sequence. Think of it as a branching structure, like a tree, where each branch represents a possible outcome.
Tree diagrams are particularly useful when you need to:
- Organise multiple events in a clear, visual way
- Calculate probabilities for compound events
- Ensure you haven't missed any possible outcomes
The visual nature of tree diagrams makes them especially powerful for complex probability problems where it's easy to lose track of different possible outcomes. They provide a systematic way to ensure completeness.
How to construct a tree diagram
When drawing a tree diagram, follow these essential steps:
- Start with the first event - Draw branches from a starting point, one for each possible outcome
- Label each branch - Write the outcome at the end of each branch
- Add probabilities - Write the probability of each outcome on its branch
- Continue for subsequent events - From each outcome, draw new branches for the next event
- Calculate final probabilities - Multiply probabilities along each complete path
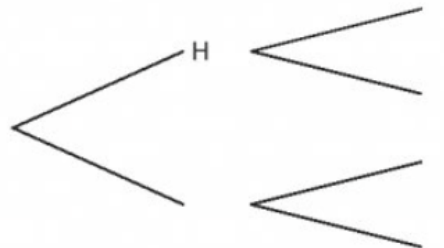
Basic structure
In a tree diagram representing a coin toss, there are two branches representing the two possible outcomes (heads or tails). The probability of each outcome is written on the corresponding branch.
The multiplication rule
The key principle for tree diagrams is the multiplication rule:
Probabilities along the branches are found by multiplying
This is the fundamental rule that makes tree diagrams work. Never add probabilities along a single path - always multiply them.
When you want to find the probability of a sequence of events occurring, you multiply the probabilities along the path through the tree diagram.
For example, if Event A has probability and Event B has probability , then:
Working with compound events
Tree diagrams become particularly powerful when dealing with compound events involving two or more sequential activities.
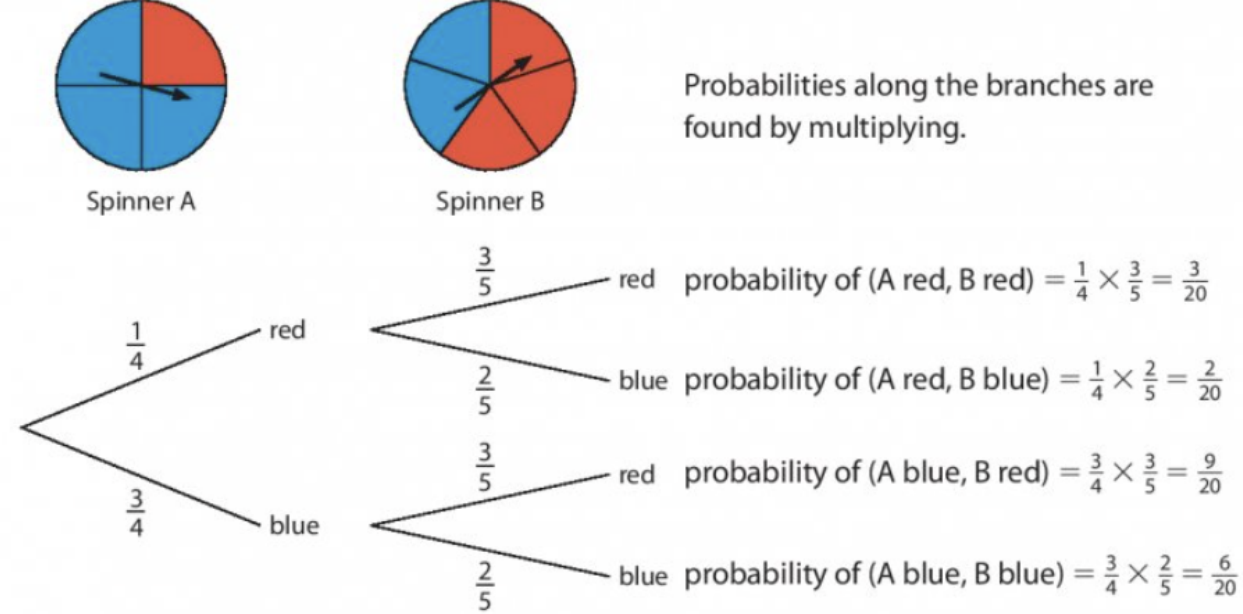
The diagram above shows two spinners being spun in sequence. Notice how each complete path through the tree represents one possible outcome, and the final probability is calculated by multiplying the probabilities along that path.
Worked example: Box and beads problem
Let's examine a complete worked example to see how tree diagrams solve real probability problems.
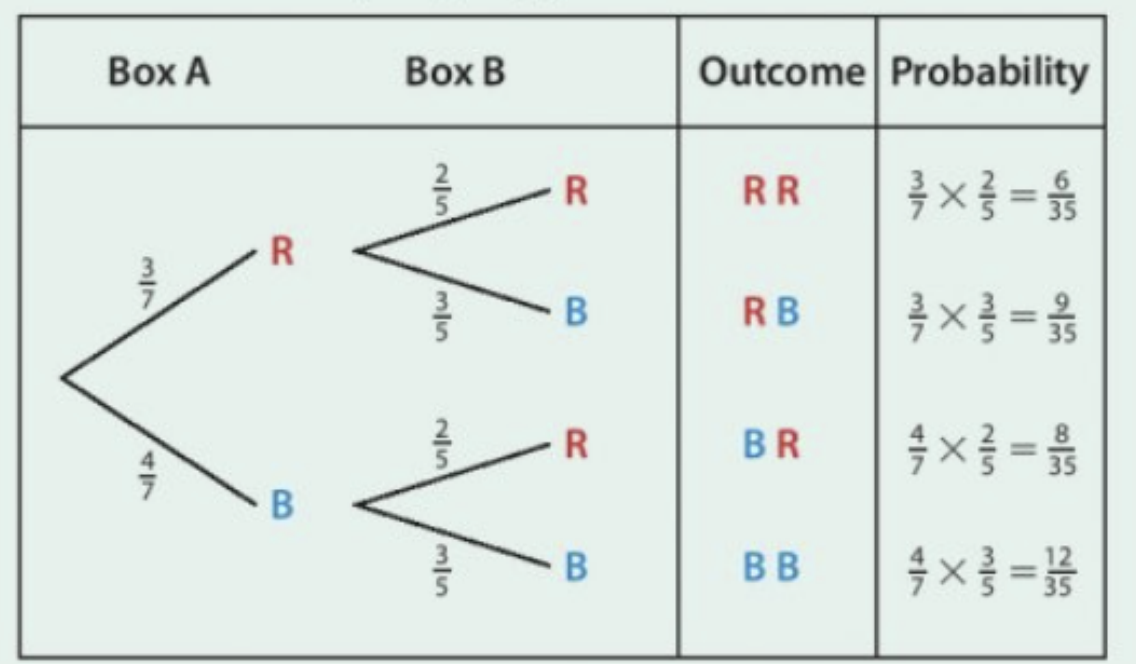
Worked Example: Box and Beads Problem
Problem: Box A contains 3 red beads and 4 blue beads. Box B contains 2 red beads and 3 blue beads. One bead is taken at random from each box. Find the probability that both beads have the same colour.
Solution:
First, we identify the probabilities for each box:
- Box A: P(red) = , P(blue) =
- Box B: P(red) = , P(blue) =
The tree diagram shows all possible outcomes. To find each final probability, we multiply along the branches:
- P(red, red) =
- P(red, blue) =
- P(blue, red) =
- P(blue, blue) =
For the probability that both beads have the same colour, we need either both red OR both blue:
Important properties and checks
Probability sum check
A crucial property to remember is that the sum of all final probabilities must equal 1. This serves as an excellent way to check your work:
✓
When working with fractions in tree diagrams, it's often better not to simplify them until the end. This makes addition and comparison much easier.
Exam tips and common mistakes
Understanding what to do and what to avoid is essential for exam success:
Do:
- Always multiply probabilities along branches (not add them)
- Check that probabilities from each stage sum to 1
- Draw neat, clear diagrams with proper labelling
- Show all working clearly
Avoid:
- Adding probabilities along branches instead of multiplying
- Forgetting to include all possible outcomes
- Mixing up "and" (multiply) with "or" (add)
- Not checking that final probabilities sum to 1
Common Mistake Alert: The most frequent error students make is confusing when to multiply versus when to add probabilities. Remember: multiply along branches for "and" situations, add across different branches for "or" situations.
Types of problems you might see
Tree diagrams appear in various Leaving Cert contexts:
- Multiple coin tosses - finding probability of specific sequences
- Spinner combinations - dealing with different coloured sections
- Box and bead scenarios - drawing items from containers
- Dice rolling - sequential throws with different outcomes
- Weighted coins or dice - non-equal probabilities
Key Points to Remember:
- Tree diagrams show all possible outcomes for sequential events using a branching structure
- Multiply probabilities along branches to find the probability of compound events
- Add probabilities across different branches when you want "either this OR that"
- All final probabilities must sum to 1 - use this to check your calculations
- Draw first, calculate second - always sketch the diagram before doing arithmetic