Venn Diagrams (Leaving Cert Mathematics): Revision Notes
Venn Diagrams
What are Venn diagrams?
A Venn diagram is a visual way to show the relationships between different sets or groups. These diagrams use circles to represent different sets, and they help us easily see which elements belong to which groups. In probability, Venn diagrams are particularly useful because they make it simple to calculate the chances of different events happening.
Venn diagrams are one of the most powerful visual tools in probability because they transform abstract mathematical concepts into clear, visual representations that make complex calculations much more intuitive.
Components of a Venn diagram
Every Venn diagram has several important parts that you need to understand:
-
Universal set (U): This is represented by a rectangle that contains everything we're considering. It includes all possible outcomes in our scenario.
-
Individual sets: These are shown as circles inside the rectangle. Each circle represents a specific group or event we're studying.
-
Intersection: When circles overlap, the overlapping area shows elements that belong to both sets. This represents events happening together.
-
Regions outside circles: The area inside the rectangle but outside all circles represents elements that don't belong to any of the sets.
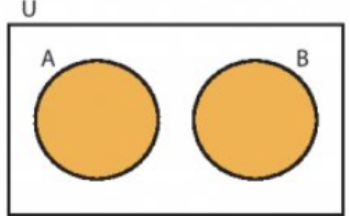
This diagram shows two separate sets A and B that don't overlap, meaning they have no elements in common.
Reading Venn diagrams
When you look at a Venn diagram with numbers, each region tells you how many elements are in that particular area. Let's break down what each region means:
- Left circle only: Elements that belong to set A but not to set B
- Right circle only: Elements that belong to set B but not to set A
- Overlapping area: Elements that belong to both set A and set B
- Outside both circles: Elements that belong to neither set A nor set B
The total number of elements in the universal set equals the sum of all these regions. This is a useful way to check your work - all the individual regions should add up to the total given in the problem.
Calculating probabilities from Venn diagrams
Once you understand what each region represents, calculating probabilities becomes straightforward. The probability of any event is always:
Here are the key probability calculations you'll need:
- : Probability of both events occurring =
- : Probability of either event occurring =
- : Probability of neither event occurring =
- : Probability of B but not A =
Essential Formula to Remember:
The fundamental probability formula is the foundation of all Venn diagram calculations. Always identify your favourable outcomes first, then divide by the total. This approach works for every type of probability question.
Mutually exclusive events
Sometimes, two events cannot happen at the same time. These are called mutually exclusive events. In a Venn diagram, mutually exclusive events are shown as two circles that don't overlap at all.
When events are mutually exclusive, the formula for "A or B" becomes simpler:
This is because there's no overlap to subtract, unlike with overlapping events.
When to Use the Simplified Formula:
Only use when the circles in your Venn diagram don't touch or overlap. If there's any intersection between the sets, you must use the full formula that accounts for the overlap.
Worked example 1: Sports club membership
Let's work through a complete example using real data from a sports club.
Worked Example: Sports Club Probability Calculations
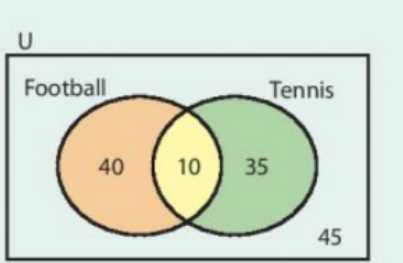
A sports club has members who play different sports. The Venn diagram shows:
- 40 members play football only
- 35 members play tennis only
- 10 members play both sports
- 45 members play neither sport
Step 1: Find the total membership Total = 40 + 10 + 35 + 45 = 130 members
Step 2: Calculate each probability
(i) Both football and tennis:
(ii) Tennis but not football:
(iii) Neither sport:
(iv) Football or tennis:
Worked example 2: Academic subjects
Worked Example: Academic Subject Selection
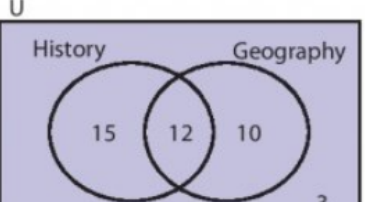
In a class of 40 students studying History and Geography:
- 15 study History only
- 12 study both subjects
- 10 study Geography only
- 3 study neither subject
Let's verify: 15 + 12 + 10 + 3 = 40 ✓
If we select a student at random:
P(took Geography) =
P(took both subjects) =
P(took neither subject) =
Worked example 3: Finding unknown values
Worked Example: Solving for Unknown Values
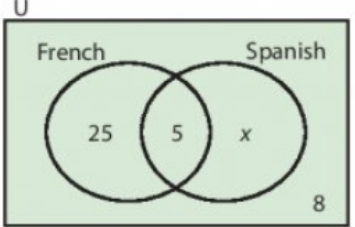
Sometimes you need to find missing values. In this language class of 50 students:
- 25 study French only
- 5 study both languages
- x study Spanish only
- 8 study neither language
Step 1: Set up the equation Since the total is 50: 25 + 5 + x + 8 = 50
Step 2: Solve for x 38 + x = 50, so x = 12
Step 3: Calculate probabilities
- P(French) =
- P(both languages) =
- P(Spanish only) =
Common exam tips
Critical Exam Success Strategies:
- Always check that all regions in your Venn diagram add up to the total given - this catches most calculation errors
- Remember that "A or B" includes the overlap region (both A and B)
- "A and B" refers only to the intersection (overlap) region
- When finding "A only", subtract the intersection from the total for A
- Be careful with the phrase "at least one" - this means "A or B"
- "Exactly one" means "A only" plus "B only" (but not both)
Key Points to Remember:
-
Venn diagrams visually represent relationships between sets - use circles inside a rectangle to show how groups overlap or stay separate
-
Each region has a specific meaning - overlap shows "and", the whole shaded area shows "or", and outside both circles shows "neither"
-
Always verify your total - add all regions together to check they equal the given total number
-
Mutually exclusive events don't overlap - when circles don't touch, use
-
Read questions carefully - distinguish between "and", "or", "only", and "neither" as they refer to different regions of the diagram