Overview of Reports (Grade 11 NSC Matric Computer Application Technology): Revision Notes
Overview of Reports
What are reports?
Reports are one of the most powerful features that databases offer. Think of a report as a professional way to present your database information in an organised, easy-to-read format. Unlike simply viewing data in tables, reports allow you to format, summarise, and present information for specific purposes.
The key difference between viewing data in tables versus reports is that tables show raw data in rows and columns, while reports can format, group, and summarise that same data in ways that make it much more meaningful and presentable to others.
For example, you might create a simple report showing all students in your grade with their contact details, or you could build a more complex report that displays a company's total sales across different branches over several years. Reports transform raw data into meaningful, presentable information.
Purpose and benefits of reports
Reports serve as database objects that help you present information effectively. They are particularly useful for several key purposes:
Displaying and distributing data summaries - Reports can take large amounts of data and present just the key information you need, making it easier for others to understand trends and patterns.
Creating data snapshots - You can capture the state of your database at a specific point in time, which is useful for record-keeping and historical analysis.
Showing individual record details - Reports can focus on specific records and present them in a clear, formatted way that's easy to read and understand.
Generating labels and documents - Reports can be formatted to create mailing labels, certificates, or other standardised documents using your database information.
The great advantage is that creating reports in Access is relatively straightforward, especially when your database is well-designed with proper relationships and field names.
Report sections and structure
Every report is made up of different sections, each serving a specific purpose. Understanding these sections helps you create professional-looking reports that present information logically.
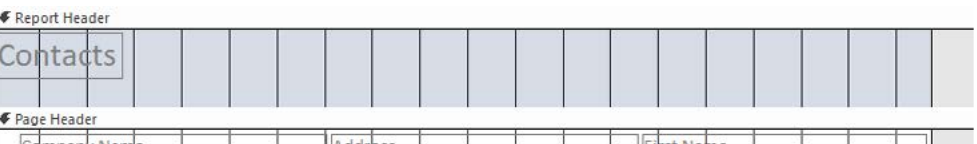
Report header appears at the very beginning of your report, typically on the first page. This is where you place information that applies to the entire report, such as a company logo, the report title, or the date the report was generated.
Page header appears at the top of every page in your report. This section is perfect for repeating the report title on each page, ensuring readers always know what they're looking at.
Group header appears at the beginning of each new group of records when you've organised your data by categories. For instance, if you're grouping students by grade level, the group header would display the grade name before listing the students in that grade.
Detail section is where the actual data from your records appears. This section repeats once for every row in your data source, displaying the main content of your report.
Page footer appears at the bottom of every page and typically contains page numbers or other per-page information like the date or time the report was printed.
Report footer appears only at the very end of your report and is ideal for displaying totals, summaries, or conclusions that apply to all the data in your report.
Creating reports with Report Wizard
The Report Wizard is a helpful tool that guides you through the report creation process step by step. This makes creating professional reports much easier, especially when you're starting out.
The wizard process involves several key decisions that shape your final report. First, you'll select which table or query contains the data you want to report on. This is crucial because it determines what information will be available for your report.
Worked Example: Report Wizard Process
Step 1: Data Source Selection Choose the table containing student information
Step 2: Field Selection Select: Student Name, Grade Level, Contact Details
Step 3: Sorting Options Primary sort: Grade Level, Secondary sort: Student Surname
Step 4: Layout Choice Select tabular layout with portrait orientation
Step 5: Final Setup Title: "Student Contact Directory", choose Preview option
Next, you'll choose which specific fields to include in your report. You can add fields one at a time for precise control, or select all fields at once if you need comprehensive information. Remember that you can always modify this later, so don't worry about getting it perfect on the first try.
The wizard then asks how you want your records sorted. Proper sorting makes your report much more useful - for example, sorting students alphabetically by surname or organising sales data by date. You can sort by multiple fields to create more sophisticated arrangements.
Layout options come next, where you choose between different formats like columnar (data arranged in columns), tabular (like a spreadsheet), or justified layouts. You also select orientation - portrait works well for reports with fewer fields, while landscape accommodates reports with many columns.
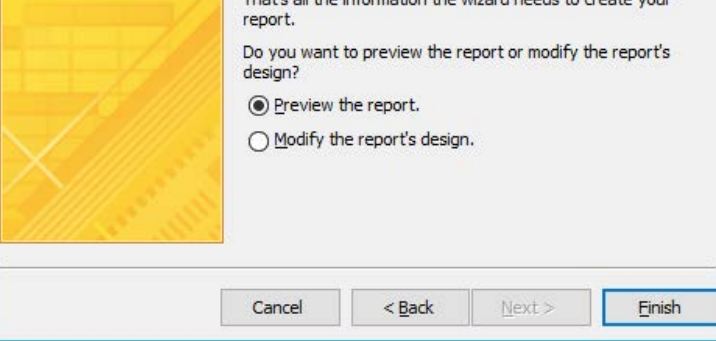
Finally, you'll give your report a meaningful title and choose whether to preview it immediately or modify its design further. The preview option is usually best for beginners as it lets you see results quickly.
Adding calculations to reports
One of the most powerful features of reports is the ability to add calculations that summarise your data automatically. This transforms your report from a simple data listing into a meaningful analysis tool.
Access provides several built-in calculation functions that handle the most common summarisation needs:
Sum() function adds up all the numerical values in a column, perfect for totalling sales figures, expenses, or quantities. The Sum() function works with any numerical field in your report.
Avg() function calculates the mean value of all numbers in a column, useful for finding average scores, typical prices, or standard measurements. The Avg() function handles the mathematical calculation automatically.
Count() function tells you how many items appear in a column, regardless of whether they contain numbers or text. Count() is invaluable for determining quantities like "number of students" or "total orders processed."
Max() function identifies the highest value in a column, whether numerical or alphabetical. Max() helps you find top performers, highest scores, or the latest dates in your data.
Min() function finds the lowest value in a column, useful for identifying bottom performers, earliest dates, or minimum requirements. Min() works with both numbers and text.
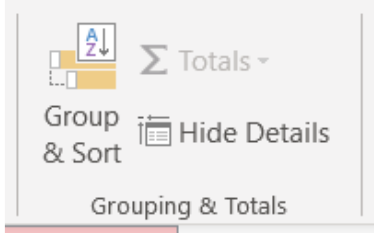
These calculations can be added in either Layout view (which shows your data while you work) or Design view (which focuses on the report structure). You typically add calculations to group footers when you want subtotals for each group, or to the report footer when you want overall totals.
Working with headers and footers
Headers and footers provide consistency and professionalism to your reports by displaying information that applies to multiple pages or the entire report. Understanding how to use them effectively makes your reports look polished and easier to navigate.
Page footers are particularly useful for including dates, times, and page numbers. This information helps readers understand when the report was created and navigate through multi-page documents easily.
Report headers serve as the "cover page" information for your entire report. Here you might include your organisation's name, the report title, the date range of the data, or other contextual information that helps readers understand what they're looking at.
The key principle is that any information appearing in a header or footer should be relevant to that entire section. Page information goes in page headers and footers, while report-wide information belongs in report headers and footers.
When you have grouped data in your report, you might also see group headers and footers. These are automatically named based on the field or expression you're grouping by, and they provide space for group-specific information like subtotals or category descriptions.
Import and export data functionality
Reports often need data from various sources, and Access provides excellent tools for bringing information in from other applications and sharing your results externally.
Importing from Excel is one of the most common data import tasks. Rather than manually retyping information, you can directly copy data from Excel spreadsheets into Access tables, which can then be used in reports. The process involves selecting your data in Excel, copying it, and then pasting it into the appropriate Access table fields.
Importing from text files gives you flexibility to work with data from many different sources. CSV (Comma-Separated Values) files are particularly common and work well with Access. Before importing text files, you should ensure they're properly formatted with consistent delimiters (usually commas or semicolons) and that field names appear in the first row.
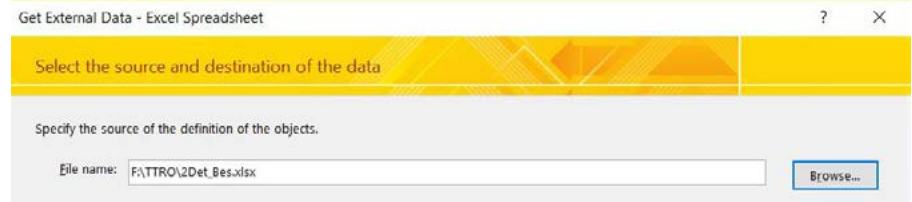
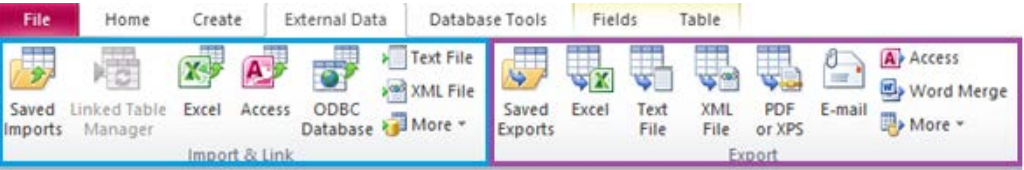
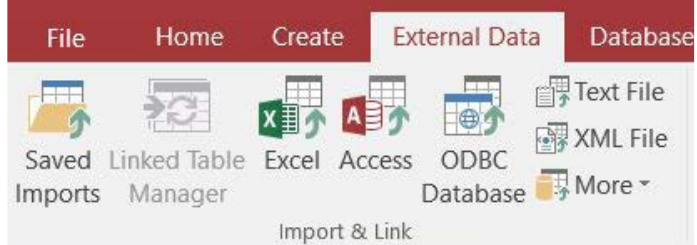
The External Data tab in Access provides a comprehensive set of import and export tools. You can bring in data from Excel, other Access databases, text files, and even more specialised sources. The import wizards guide you through the process, helping you map fields correctly and handle data type conversions.
Export capabilities work in reverse, allowing you to share your Access data and reports with others who might not have Access. You can export to Excel for further analysis, to PDF for professional document sharing, or to various other formats depending on your needs.
When importing data, it's important to plan ahead. Make sure your source data is clean and consistently formatted. Field names should be in the first row, and you should remove any extra characters or spaces that might cause problems. The import process works best when your data follows standard database principles of organisation.
Key Points to Remember:
-
Reports transform raw database information into professional, formatted presentations that are easy to read and understand
-
Every report consists of different sections (headers, detail, footers) that serve specific purposes and help organise information logically
-
The Report Wizard provides step-by-step guidance for creating reports, making the process accessible even for beginners
-
Built-in calculation functions (Sum(), Avg(), Count(), Max(), Min()) automatically summarise your data and provide meaningful insights
-
Import and export capabilities allow you to work with data from various sources and share your results in different formats for maximum flexibility