Exponential and Logarithmic Functions (HSC SSCE Mathematics Advanced): Revision Notes
Exponential and Logarithmic Functions
Learning outcomes
After studying this topic, you will be able to:
- Use shifts, flips, and stretches to transform exponential and logarithmic functions
- Find the equation of a transformed exponential or logarithmic function
- Recognize how transformations change key features such as asymptotes, domain, and range
- Draw accurate graphs of transformed exponential and logarithmic functions
Translations of exponential functions
A translation shifts an exponential function's graph horizontally or vertically. When working with exponential functions of the form , we need to be careful with notation. Since the letter is already used as the base, we write translations using rather than .
The general form for a translated exponential function is:
Understanding the parameters:
The parameter h controls the horizontal shift:
- If , the graph shifts right
- If , the graph shifts left
The parameter b controls the vertical shift:
- If , the graph shifts up
- If , the graph shifts down
Key features of translated exponential functions:
- Domain: (unchanged)
- Range: if , or if
- Horizontal asymptote:
The horizontal asymptote moves with the vertical shift. If you shift the graph up by units, the asymptote also shifts up by units.
Worked Example: Translating an Exponential Function
Question: Translate right by units and down by unit.
Part a: Find the equation of the transformed function
To translate right by 3 units, replace with .
To translate down by 1 unit, subtract from the entire function.
Therefore: and
Starting with:
Apply the translations:
The transformed function is g(x) = 2^{x-3} - 1.
Part b: Find the horizontal asymptote
The asymptote occurs at .
Since , the asymptote is y = -1.
Part c: Find the y-intercept
To find the y-intercept, substitute into the equation.
The y-intercept is .
Part d: Sketch the graph
To sketch the graph:
- Plot the y-intercept at
- Draw the horizontal asymptote at as a dashed line
- Plot additional key points if needed
- Draw the exponential curve approaching the asymptote
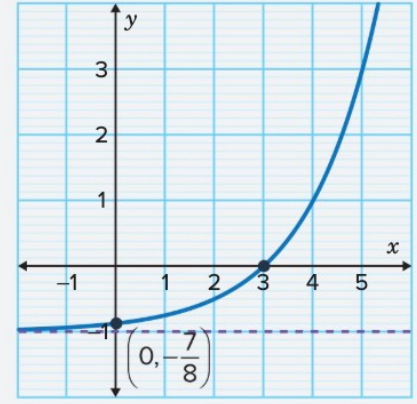
The graph shows with the asymptote at .
To check your work, compare the original and transformed functions:
The original function (shown in teal) has been shifted right by 3 units and down by 1 unit to create (shown in blue). Notice how the asymptote has moved from to .
Reflections of exponential functions
A reflection flips an exponential function's graph over an axis. For exponential functions of the form :
Reflection over the x-axis:
This flips the graph vertically.
Reflection over the y-axis:
This flips the graph horizontally.
Key features after reflection:
- Domain: (unchanged)
- Range: for when
- Horizontal asymptote: (unchanged for basic reflections)
When you reflect over the x-axis, positive values become negative, so the range changes. When you reflect over the y-axis, the graph flips horizontally but keeps the same range.
Worked Example: Reflecting an Exponential Function
Question: Reflect over the x-axis.
Part a: Find the equation of the transformed function
To reflect over the x-axis, multiply the function by .
Starting with:
Reflect over the x-axis:
The transformed function is g(x) = -2^x.
Part b: Find the range
For the original function , we know that for all .
After reflecting over the x-axis, for all .
Therefore, the range is .
Part c: Find the horizontal asymptote
The horizontal asymptote for is y = 0.
This asymptote is approached from below (since all y-values are negative).
Part d: Sketch the graph
To sketch the graph, we need some key points.
Find the y-intercept by substituting :
The y-intercept is .
Find another point by substituting :
Another key point is .
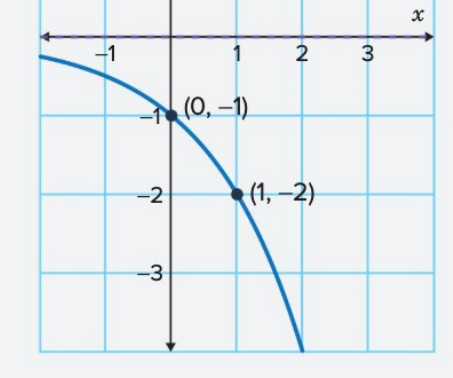
The graph shows reflected over the x-axis. Notice that the curve now decreases as x increases, and all y-values are negative. The horizontal asymptote remains at , but the graph approaches it from below.
Translations of logarithmic functions
A translation shifts a logarithmic function's graph horizontally or vertically. For logarithmic functions of the form :
Where:
- h controls the horizontal shift:
- If , shift right
- If , shift left
- b controls the vertical shift:
- If , shift up
- If , shift down
Key features of translated logarithmic functions:
- Domain:
- Range: (unchanged)
- Vertical asymptote:
The vertical asymptote moves with the horizontal shift. If you shift the graph right by units, the asymptote also shifts right by units. This is different from exponential functions, where the horizontal asymptote moves with the vertical shift.
Worked Example: Translating a Logarithmic Function
Question: Translate left by units and up by unit.
Part a: Find the equation of the transformed function
To translate left by 2 units, replace with (note: left means ).
To translate up by 1 unit, add to the function.
Starting with:
Apply the translations with and :
The transformed function is g(x) = \log_3(x + 2) + 1.
Part b: Find the domain
The logarithm is only defined when its argument is positive.
We need
Solving:
The domain is .
Part c: Find the vertical asymptote
The vertical asymptote occurs at .
Since , the asymptote is x = -2.
Part d: Sketch the graph
Find the y-intercept by substituting :
The y-intercept is approximately .
Find another point by substituting :
Another point is .
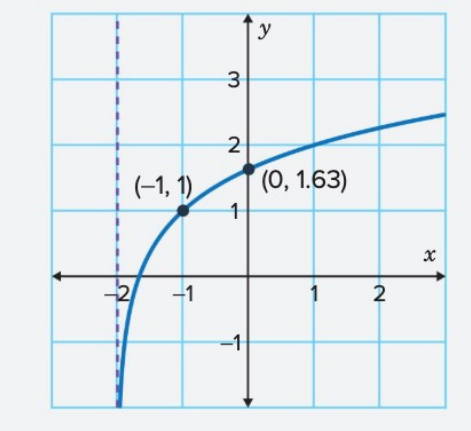
The graph shows with the vertical asymptote at . The curve increases from left to right, passing through the points we calculated.
Dilations of exponential functions
A dilation stretches or compresses an exponential function vertically. For exponential functions of the form :
Where l is the vertical dilation factor:
- If , the graph stretches vertically
- If , the graph compresses vertically
Key features of dilated exponential functions:
- Domain: (unchanged)
- Range: if and , or if
- Horizontal asymptote: (unchanged)
The horizontal asymptote stays at y = 0 because we're stretching vertically, not shifting the graph. Dilations change how steep the curve is, but they don't move the asymptote.
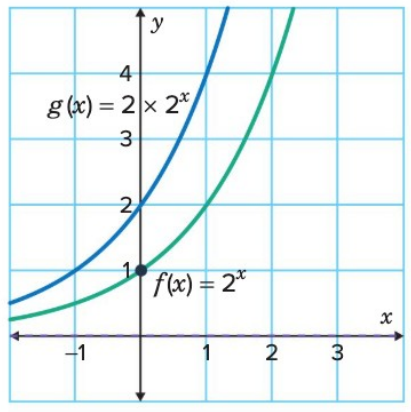
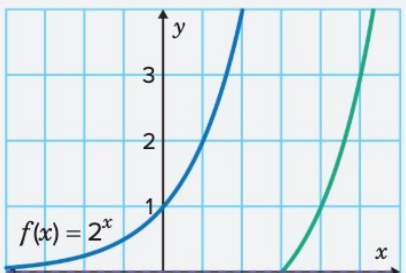
This graph compares (teal) with (blue). The blue curve is stretched vertically by a factor of , making it rise more steeply.
Worked Example: Dilating an Exponential Function
Question: Dilate vertically by a factor of .
Part a: Find the equation of the transformed function
To dilate vertically by a factor of , multiply the function by .
Starting with:
Apply the dilation with :
The transformed function is g(x) = 3 × 2^x.
Part b: Find the y-intercept
Substitute into the equation:
The y-intercept is (0, 3).
Part c: Sketch the graph
Find another point by substituting :
The point at is .
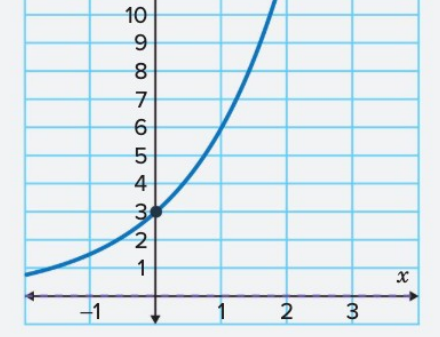
The graph shows dilated vertically with the horizontal asymptote at . The curve passes through and , rising more steeply than the original function.
Dilations of logarithmic functions
A dilation stretches or compresses a logarithmic function vertically. For logarithmic functions of the form :
Where l is the vertical dilation factor:
- If , the graph stretches vertically
- If , the graph compresses vertically
Key features of dilated logarithmic functions:
- Domain: (unchanged)
- Range: (unchanged)
- Vertical asymptote: (unchanged)
The vertical asymptote stays at x = 0 because we're stretching vertically, not shifting the graph horizontally. Dilations change how steep the curve is, but they don't move the asymptote.
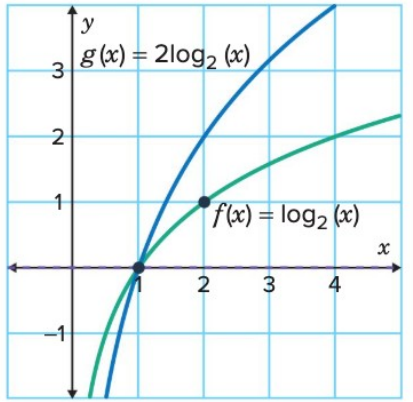
This graph compares (teal) with (blue). The blue curve is stretched vertically by a factor of , making it rise more steeply.
Worked Example: Dilating a Logarithmic Function
Question: Dilate vertically by a factor of .
Part a: Find the equation of the transformed function
To dilate vertically by a factor of , multiply the function by .
Starting with:
Apply the dilation with :
The transformed function is g(x) = 3 log₂ x.
Part b: Find the y-coordinate at x = 2
Substitute into the equation:
The point at is (2, 3).
Note: because .
Part c: Sketch the graph
To sketch the graph, we also need the x-intercept.
The x-intercept occurs when . For logarithmic functions, this happens when the argument equals .
For the original function , the x-intercept is at .
After dilation, this point remains at because:
Plot the vertical asymptote at , the x-intercept at , and the point .
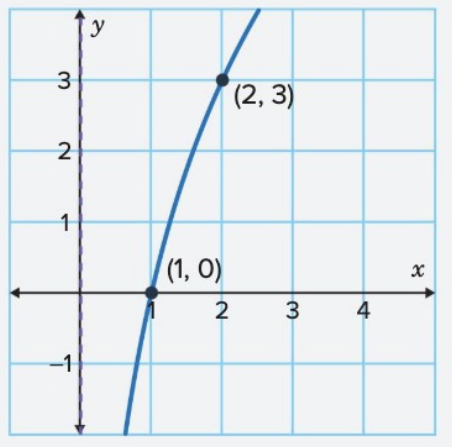
The graph shows dilated vertically with the vertical asymptote at . The curve passes through and , rising more steeply than the original function.
Key Points to Remember:
-
Translations shift the graph horizontally (by ) and vertically (by ). For exponential functions, the asymptote moves to . For logarithmic functions, the asymptote moves to .
-
Reflections flip the graph over an axis. Reflecting over the x-axis changes to , and reflecting over the y-axis changes to . The asymptote stays the same but may be approached from a different direction.
-
Dilations stretch or compress the graph vertically by a factor of . If , the graph stretches. If , the graph compresses. The asymptote position doesn't change with dilations.
-
Always sketch key points: For exponential functions, find the y-intercept (set ). For logarithmic functions, find where the graph crosses the axes. Also plot the asymptote as a dashed line.
-
Domain and range change differently: Translations affect both domain and range for logarithmic functions but only range for exponential functions. Reflections can change range but not domain. Dilations don't change domain or range extent, just the steepness of the curve.