Linear, Quadratic and Cubic Functions (HSC SSCE Mathematics Advanced): Revision Notes
Linear, Quadratic and Cubic Functions
Introduction
This topic explores how to apply transformations to linear, quadratic, and cubic functions. Understanding these transformations helps you analyse and sketch graphs efficiently, predict how functions behave, and solve practical problems. You will learn to translate, reflect, and dilate functions, as well as combine multiple transformations to map one function to another.
Mastering function transformations is essential for graph sketching and analysis. These skills allow you to visualize how functions change without plotting every point individually, saving time and improving your mathematical intuition.
Key definitions
Before working with transformations, it is important to understand these fundamental concepts:
Domain: The set of real numbers for which a function or relation is defined. In other words, the domain contains all possible -values that can be input into the function.
Range: The set of values of the dependent variable for which a function is defined. The range represents all possible -values that the function can produce.
Intercept: The point at which a curve or function crosses an axis or another curve. The -intercept occurs where (the curve crosses the -axis), and the -intercept occurs where (the curve crosses the -axis). For example, in the line , the -intercept is .
Translation: A type of transformation that moves a shape or all points in a plane by the same amount to the left or right, or up or down. Translations preserve the size and orientation of the original shape.
Function: A function assigns to each element of one set precisely one element of a second set . Each input has exactly one output.
Reflection: A transformation that creates a mirror image of a shape on the other side of a given line. Reflections flip the graph over an axis.
Vertex: A point in the plane where lines meet and do not extend beyond. For parabolas, the vertex is the turning point—the maximum or minimum point of the curve.
Dilation: A process of stretching or compressing the graph of a function. This can happen in the or direction, or both, changing the steepness or width of the graph.
Transformation: A procedure or set of procedures that changes the size and/or shape of an image. Transformations operate on points in the plane to change aspects such as position, size, or shape of curves and figures.
Translations of linear functions
A translation shifts the graph of a function horizontally or vertically without changing its shape or orientation. For linear functions, translations move the line but do not affect its slope (gradient).
Understanding Translations
Think of translations as "sliding" the entire graph in a particular direction. The graph's shape remains identical—only its position changes. This is why the slope (gradient) of a linear function stays the same after translation.
For a linear function , translations are applied using the formula:
Where:
- is the transformed function
- is the horizontal shift: right if , left if
- is the vertical shift: up if , down if
Common Mistake Alert
When translating right, we use with a positive value of . This often confuses students who expect a plus sign. Remember: "subtract to shift right, add to shift left" for horizontal translations.
Effect on domain and range: The domain of a translated linear function remains . The range also remains unless , in which case the function becomes a horizontal line with range . Translations do not restrict input values but may affect the range in specific cases.
Worked Example: Translating a Linear Function
Consider the function . We will translate it right by unit and up by units.
Part a: Determine the equation of the transformed function
Use the translation form with and :
The transformed function is .
Part b: Determine the y-intercept
Substitute into the transformed equation:
The -intercept is at .
Part c: Sketch the graph of the transformed function
To sketch , start by plotting the -intercept at . Since the gradient is , move unit to the right and units up to plot a second point at . Draw a straight line through these two points to complete the graph.
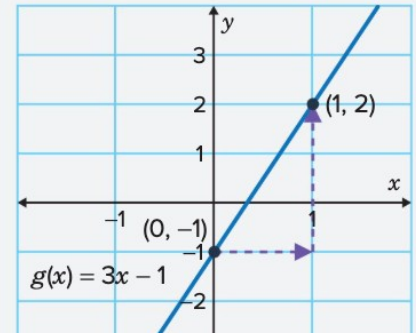
The original function had a -intercept at . The vertical shift up by units and horizontal shift right by unit changed this point to on the transformed graph.
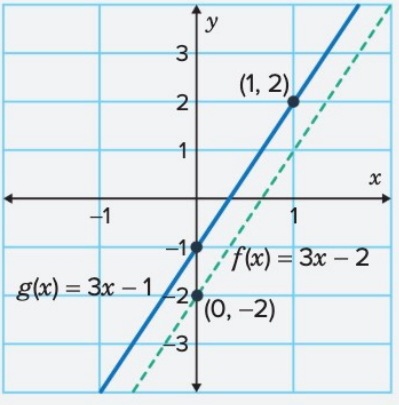
Key insight: Translations shift the entire graph without changing its slope. The line remains parallel to the original, but its position on the coordinate plane changes according to the values of and .
Reflections of quadratic functions
A reflection flips the graph of a function over an axis, creating a mirror image. For quadratic functions, reflections can dramatically change the appearance and range of the parabola.
For a quadratic function , reflections are applied as follows:
Reflection over the x-axis:
This flips the graph vertically. An upward-opening parabola becomes downward-opening, and vice versa.
Reflection over the y-axis:
This flips the graph horizontally, swapping left and right sides.
Effect on Key Features
The vertex changes position based on the reflection type, but the domain remains . The range depends on the concavity (direction of opening) and the new vertex position after reflection.
When reflecting over the -axis, a parabola with a maximum becomes one with a minimum, and vice versa. This fundamentally changes the range of the function.
Worked Example: Reflecting a Quadratic Function
Reflect the function over the -axis.
Part a: Determine the equation of the transformed function
Apply the reflection :
The transformed function is .
Part b: Determine the vertex of the transformed function
Compare the transformed equation to vertex form where is the vertex.
For , we have and .
The vertex is .
Part c: Determine the y-intercept
Substitute into the transformed function:
The -intercept is at .
Important Note About Y-Intercepts
The transformed function is not in the general form , so in cannot be considered as the -intercept directly. For this reason, the -intercept must always be calculated by substituting .
Part d: Determine the range of the transformed function
Check whether the parabola opens upwards or downwards by examining the coefficient of the squared term.
Since , the parabola is concave down, with a maximum at the vertex .
The range is .
Part e: Sketch the graph of the transformed function
Plot the vertex at and the -intercept at . Since the parabola is concave down, sketch a smooth curve through these points that opens downwards.
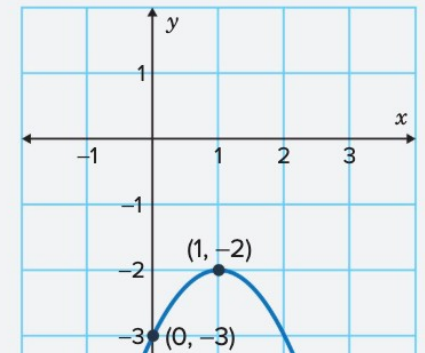
The graph shows that reflecting over the -axis has inverted the parabola. The original function opened upwards with vertex at , while the reflected function opens downwards with vertex at .
Key insight: Reflection over the -axis changes the sign of the entire function, which inverts the parabola and alters its range. The domain remains unchanged at .
Dilations of cubic functions
A dilation stretches or compresses the graph of a function either vertically or horizontally. For cubic functions, vertical dilations change how steep or flat the curve appears.
For a cubic function , a vertical dilation is applied as:
Where is the dilation factor:
- If , the graph stretches (becomes steeper)
- If , the graph compresses (becomes flatter)
Effect on Key Features
The stationary point at remains at the origin for vertical dilations of cubic functions. The domain and range both remain .
Unlike translations and reflections, dilations change the rate at which function values increase or decrease, but they don't shift the position of key points like the origin.
Worked Example: Dilating a Cubic Function
Dilate the function vertically by a factor of .
Part a: Determine the equation of the transformed function
Apply the dilation with :
The transformed function is .
Part b: Determine the stationary point
For vertical dilations of a cubic function, the stationary point remains at the origin.
The stationary point is at .
Part c: Sketch the graph of the transformed function
Plot the stationary point at and calculate key points to show the curve's behaviour.
For :
For :
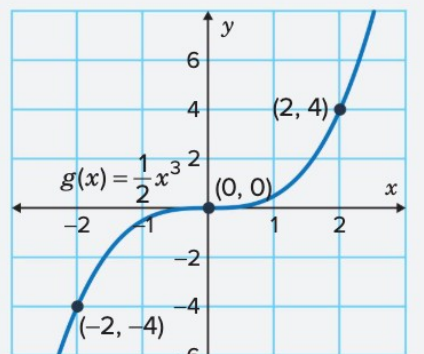
The graph of is less steep than because the dilation factor compresses the curve vertically. Points are connected with a smooth curve to show the characteristic S-shape of cubic functions.
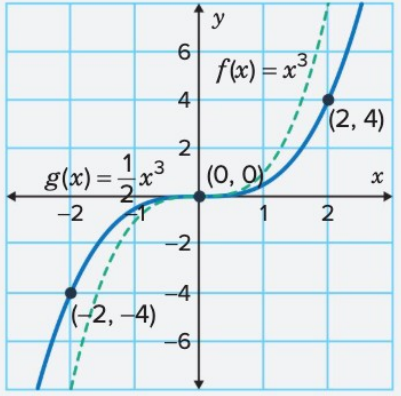
Key insight: Vertical dilations by factors between and compress the graph, making it appear flatter. The stationary point remains fixed at the origin, and the overall shape of the cubic curve is preserved.
Combined transformations
When multiple transformations are applied to a function, the order in which they are performed matters. Generally, transformations are applied in this sequence: dilation or reflection first, then translations.
Combining translation, reflection, and dilation transforms linear, quadratic, or cubic functions systematically. Understanding the correct order ensures accurate results when mapping one function to another.
Order Matters!
Always apply transformations in this order:
- Dilation or reflection (changes to the function's shape)
- Translation (shifts in position)
Applying translations before dilations or reflections will produce incorrect results because the transformation affects the entire function, including any shifts already applied.
Worked Example: Multiple Transformations on a Quadratic
Transform by reflecting over the -axis, dilating vertically by , and translating right by unit and up by units.
Part a: Determine the equation of the transformed function
Apply the transformations in the correct order:
- Reflection over the -axis
- Vertical dilation by factor
- Translation right by and up by
The transformed function is .
Part b: Determine the vertex of the transformed function
Compare the equation to vertex form where is the vertex.
The equation has and .
The vertex is .
Part c: Determine the range of the transformed function
Check the concavity by examining the coefficient . The parabola is concave down with a maximum at .
The range is .
Part d: Sketch the graph of the transformed function
First, determine the -intercept by setting :
The -intercept is at .
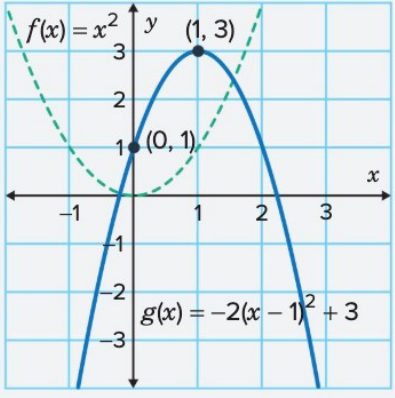
The graph shows a parabola opening downwards with vertex at and -intercept at . Points are connected with a smooth curve.
The original function had a vertex at and opened upwards. The transformed function is reflected over the -axis, stretched vertically by a factor of , and shifted right by unit and up by units, resulting in a concave down parabola with vertex at .
Key insight: The order of transformations affects the final result. By applying dilation and reflection before translations, we ensure the vertex and shape are correctly positioned. Sketching helps visualise the combined effects.
Remember!
Translations shift linear functions horizontally by units and vertically by units without changing the slope. The transformed function is . Domain and range typically remain .
Reflections flip quadratic functions over an axis. Reflection over the -axis is (vertical flip), while reflection over the -axis is (horizontal flip). The vertex position changes, and the range depends on concavity.
Dilations stretch or compress cubic functions vertically by a factor . The formula is , where stretches and compresses. The stationary point remains at the origin, and domain and range stay .
Combined transformations should be applied in order: dilation/reflection first, then translations. The sequence affects the vertex and range of the final function. Sketching visualises the combined effects.
Exam tip: Always identify the type of transformation first, then apply the appropriate formula. For combined transformations, work step-by-step through each transformation in the correct order to avoid errors.