Average Rate of Change (HSC SSCE Mathematics Advanced): Revision Notes
Average Rate of Change
What is average rate of change?
The average rate of change is a fundamental concept in calculus that helps us understand how a function behaves over a specific interval. It tells us how quickly the output of a function changes as the input values change between two points.
Think of it as measuring the overall rate at which something is changing. For example, if you're tracking the distance a car travels over time, the average rate of change would tell you the average speed over that time period.
Key definitions
Average rate of change: The change in one quantity divided by the corresponding change in another quantity.
Secant line: A straight line that passes through two points on the graph of a function.
The formula
For a function over the interval , the average rate of change is calculated using:
Where:
- represents the change in the function's output:
- represents the change in the input:
- is the starting point of the interval
- is the ending point of the interval
This formula essentially calculates "rise over run" between two points on the function. The Greek letter delta (Δ) is used to represent "change in" a quantity.
Geometric interpretation
On a graph, the average rate of change corresponds to the gradient (slope) of the secant line connecting two points on the curve. The secant line joins the points and .
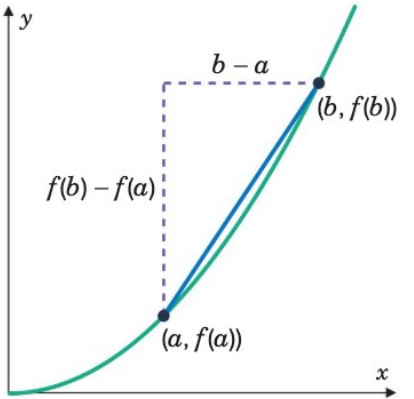
In the diagram above, you can see:
- The curve of the function
- Two points: and
- The secant line connecting these points
- The horizontal change:
- The vertical change:
The gradient of this secant line equals the average rate of change over the interval.
Worked examples
Worked Example 1: Quadratic Function
Question: For the function , find the average rate of change over the interval .
Solution:
Step 1: Identify the values
- and
Step 2: Evaluate at
Step 3: Evaluate at
Step 4: Apply the formula
Answer: The average rate of change is 4.
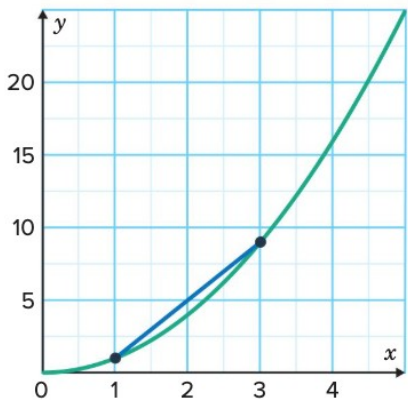
This result represents the gradient of the secant line between the points and on the graph of , as shown in the diagram above.
Worked Example 2: Real-World Application
Question: A water tank's volume is modelled by , where is in litres and is in hours. Find the average rate of change of volume from to .
Solution:
Step 1: Identify the values
- and
Step 2: Evaluate at
Step 3: Evaluate at
Step 4: Apply the formula
Answer: The average rate of change is 50 litres per hour.
Interpretation: This result tells us that the volume increases at an average rate of 50 litres per hour over the interval . This also represents the gradient of the secant line on the graph of .
Key Points to Remember:
- The average rate of change measures how much a function's output changes per unit change in input over a given interval.
- The formula is:
- Geometrically, the average rate of change equals the gradient of the secant line connecting two points on the function's graph.
- To calculate it: evaluate the function at both endpoints, find the difference in outputs, divide by the difference in inputs.
- The average rate of change has practical applications in many real-world contexts, such as calculating average speed, rate of volume change, or rate of population growth.