Multistage Events and Conditional Probability (HSC SSCE Mathematics Advanced): Revision Notes
Multistage Events and Conditional Probability
Introduction to multistage events
When we conduct experiments that involve multiple steps or stages, we call these multistage events. Each stage has its own set of possible outcomes, and the overall sample space consists of all possible sequences of outcomes across all stages.
Multistage events are experiments that consist of two or more simple experiments performed in sequence. For example, tossing a coin three times, rolling a die and then flipping a coin, or drawing cards one after another from a deck are all multistage events.
The challenge with multistage events is keeping track of all possible outcome combinations. As the number of stages increases, the total number of possible outcomes grows rapidly. This is where tree diagrams and arrays become valuable tools for organizing and visualizing all possibilities.
Tree diagrams for multistage events
What is a tree diagram?
A tree diagram is a visual tool that helps us organize and display all possible outcomes in a multistage event. It consists of line segments (called edges or branches) connected to points (called vertices or nodes), resembling the branches of a tree.
The diagram shows the relationship between different stages of the experiment and makes it easy to see all possible outcome sequences.
Structure of tree diagrams
Tree diagrams have several key features:
- They start from a single point on the left side
- Each branch represents one possible outcome at that stage
- The diagram branches out from left to right through each stage
- Final outcomes are shown at the end of the rightmost branches
- Probabilities can be written on each branch
Calculating probabilities with tree diagrams
To find the probability of a specific outcome sequence:
- Identify the path through the tree that represents your desired outcome
- Multiply the probabilities along each branch in that path
- If multiple paths lead to favourable outcomes, calculate each path's probability
- Add the probabilities from all favourable paths
Critical Rule: The probabilities on all branches leaving any single point must sum to . This ensures that all possibilities are accounted for at each stage.
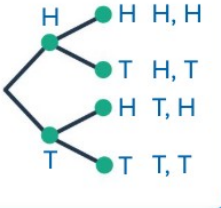
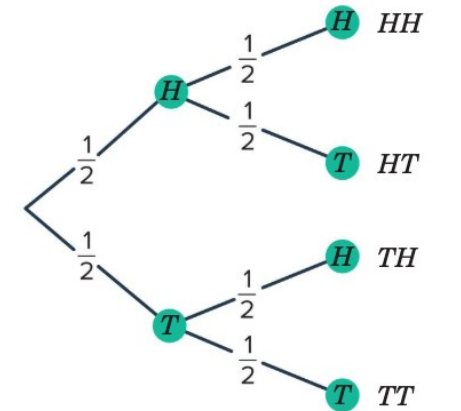
Example: Flipping two coins
Consider flipping a coin twice. The sample space is .
Example: Finding the Probability of At Least One Head
To find the probability of getting at least one head, we identify the favourable outcomes: , , and .
Step 1: Identify all favourable paths Favourable outcomes: , ,
Step 2: Calculate probability for each path
Step 3: Multiply along each path and add
The probability of getting at least one head is .
Worked example 1: Drawing balls without replacement
Worked Example: Drawing Balls Without Replacement
Problem: A bag contains 2 red balls and 3 blue balls. Two balls are drawn from the bag without replacement. Draw a tree diagram to show the possible outcomes and find the probability of drawing two red balls.
Step 1: Identify the changing probabilities
For the first draw, there are 5 balls total:
- Probability of drawing red:
- Probability of drawing blue:
For the second draw, the probabilities depend on the first draw because we don't replace the first ball.
Step 2: Construct the tree diagram
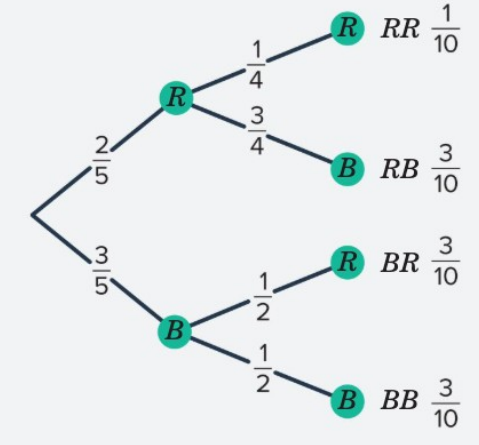
After drawing a red ball first:
- 1 red and 3 blue balls remain (4 balls total)
After drawing a blue ball first:
- 2 red and 2 blue balls remain (4 balls total)
Step 3: Calculate the probability of drawing two red balls
Follow the path for (red then red):
The probability of drawing two red balls is .
Step 4: Verify the tree diagram
Check that all final probabilities sum to 1:
✓
Key Point About "Without Replacement"
When drawing without replacement, the probabilities change after each draw because the composition of the bag changes. Always update your probabilities based on what has already been drawn. The second-stage probabilities are conditional probabilities that depend on the first outcome.
Alternative representation: Arrays
What is an array?
An array is another way to represent the sample space of multistage events. It arranges outcomes into a grid format with rows and columns.
In an array:
- Columns typically represent outcomes from one event
- Rows represent outcomes from another event
- Each cell shows the combined outcome
When to use arrays
Arrays work well when you have two events and want to see all combinations clearly. They are particularly useful when:
- Outcomes from each stage are independent
- You need to count specific combinations
- You want to visualize all possible pairings at once
- The number of outcomes is manageable in a grid format
Example: Die roll and coin flip
When rolling a standard die and flipping a coin, we can represent the sample space in an array:

This array shows all 12 possible outcomes:
- Rows represent the coin flip result ( for heads, for tails)
- Columns represent the die roll result (1 through 6)
- Each cell shows the combined outcome (e.g., means heads and rolling a 1)
From this array, we can easily count outcomes. For example, how many outcomes include heads? Count the first row: 6 outcomes.
Conditional probability
What is conditional probability?
Conditional probability measures the likelihood of an event occurring when we already know that another event has occurred. This prior knowledge restricts our sample space to only those outcomes where the given event has happened.
The notation is read as "the probability of given " or "the probability of given that has occurred."
Understanding the concept
When we calculate conditional probability, we're essentially asking: "If we know has happened, what proportion of those outcomes also include ?"
This means:
- The sample space is restricted to outcomes in
- We only consider outcomes where both and occur
- The probability depends on the relationship between and
The conditional probability formula
The conditional probability of given is calculated as:
Conditional Probability Formula
Where:
- is the number of outcomes where both and occur (the intersection)
- is the total number of outcomes in event
In probability terms, this can also be written as:
Remember: "Intersection over Total" - we divide the outcomes where both events occur by the total outcomes in the given event.
Visualizing with Venn diagrams
Venn diagrams help us understand conditional probability visually:
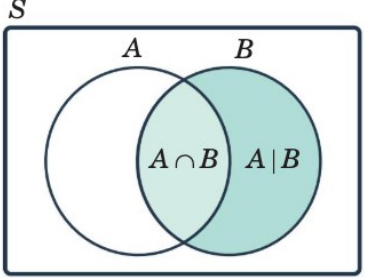
In this diagram:
- The shaded region represents the new sample space (we know has occurred)
- The intersection represents outcomes where occurs given
- The region labeled is another notation for outcomes in given we're restricted to
When calculating , we focus only on the shaded region and determine what fraction of it includes .
Using two-way tables
A two-way table (also called a contingency table) is a useful tool for organizing data that has been categorized according to two different criteria. These tables make calculating conditional probabilities straightforward.
Two-way tables:
- Display frequency distributions for two categorical variables
- Show how outcomes fall into different combinations of categories
- Make it easy to identify intersections and totals
- Are particularly helpful for conditional probability calculations
Worked example 2: Conditional probability with playing cards
Worked Example: Conditional Probability with Playing Cards
Problem: A deck of 52 cards is used. Let be the event of drawing a king, and be the event of drawing a heart.
a) Find , the probability of drawing a king given that the card is a heart.
Step 1: Write the formula
Step 2: Identify the values
Event (drawing a heart): There are 13 hearts in the deck, so
Event (drawing a king of hearts): There is exactly 1 king of hearts, so
Step 3: Substitute and calculate
The probability of drawing a king given that the card is a heart is .
b) Represent this situation in a two-way table.
We categorize the 52 cards according to:
- Whether they are a King () or not a King ()
- Whether they are a Heart () or not a Heart ()
| 1 | 3 | |
| 12 | 36 |
Verification from the table:
- (king of hearts)
- (all hearts)
- ✓
The table also shows:
- There are 4 kings total:
- There are 13 hearts total:
- The table sums to 52 cards: ✓
Exam Tip: When working with two-way tables, always verify that your row and column totals make sense. The grand total should equal the total number of items in your sample space. This helps catch calculation errors early.
Tree diagrams and conditional probability
Tree diagrams can also display conditional probabilities. The probabilities on second-stage (and later) branches are conditional probabilities because they depend on what happened in previous stages.
In our earlier example with drawing balls without replacement, the probability for drawing a second red ball was actually , a conditional probability.
Remember!
Key Points to Remember:
-
Multistage events involve multiple steps, each with its own outcomes. Use tree diagrams or arrays to organize all possible outcome sequences.
-
Tree diagrams show probability paths through branching structures. Multiply probabilities along each branch to find the probability of that outcome sequence. Add probabilities from multiple favourable paths.
-
Conditional probability represents the probability of occurring given that has already occurred. The sample space is restricted to only outcomes in .
-
The conditional probability formula is , which equals the number of outcomes where both and occur divided by the total number of outcomes in .
-
Two-way tables organize data by two categories and make conditional probability calculations easier. They help identify intersections and verify that totals are correct.