Quadratic Models (HSC SSCE Mathematics Advanced): Revision Notes
Quadratic Models
Quadratic models are powerful mathematical tools that help us understand and solve real-world problems involving parabolic relationships. In this topic, you will learn how to construct quadratic functions to represent practical situations, interpret key features of these models, and use them to solve optimisation problems.
Understanding quadratic models
A quadratic function has the general form , where , , and are constants and . These functions create parabolic graphs that can model many real-world scenarios, such as:
- The path of a projectile (like a ball being thrown)
- Calculating area or perimeter
- Determining profit margins in business
- Finding optimal solutions to practical problems
The key feature of quadratic models is their parabolic shape, which allows them to represent situations where values increase to a maximum (or decrease to a minimum) and then change direction. This characteristic makes them ideal for modeling turning point behavior in real-world applications.
Forms of quadratic functions
Quadratic functions can be written in three different forms, and each form makes certain features easier to identify. Understanding when to use each form is essential for efficient problem-solving.
Standard form
When to use: This form is particularly useful for:
- Finding the -intercept, which occurs at the point
- Solving for the roots using the quadratic formula
- Identifying the coefficients needed for calculations
Vertex form
When to use: This form directly reveals:
- The vertex of the parabola at the point
- Whether the vertex represents a maximum or minimum value
- The axis of symmetry at
The vertex gives you the maximum value when (parabola opens downward) or the minimum value when (parabola opens upward). This is crucial for optimization problems.
Factorised form
When to use: This form immediately shows:
- The -intercepts (roots) at and
- Where the function crosses the horizontal axis
- Break-even points in business applications
Finding the vertex
When you have a quadratic function in standard form, you can find the -coordinate of the vertex using the following formula:
Vertex Formula:
Once you have the -coordinate, substitute it back into the original function to find the corresponding -coordinate. This vertex point represents either the maximum or minimum value of the function.
Domain and range in quadratic models
When using quadratic functions to model real-world situations, it's essential to consider realistic constraints that limit the mathematical domain and range.
Domain
The domain represents all possible input values. While mathematically a quadratic function has domain (all real numbers), in practical applications the domain is often restricted by context.
Common Domain Restrictions:
- Time values are typically non-negative ()
- Physical dimensions must be positive
- Values between break-even points represent profitable regions
- Manufacturing or production constraints may limit quantities
Always consider the real-world context when determining the appropriate domain.
Range
The range represents all possible output values and depends on:
- The concavity of the parabola (whether it opens upward or downward)
- The -coordinate of the vertex
For a parabola:
- Opening upward (): Range is where is the -coordinate of the vertex
- Opening downward (): Range is where is the -coordinate of the vertex
Worked example: projectile motion
Worked Example: Modeling a Projectile
Problem: A ball is thrown upward from a height of 2 metres with velocity 10 m/s. Its height is modelled by , where is time in seconds and is height in metres.
Part a: Finding when the ball hits the ground
When the ball hits the ground, its height is zero, so we need to solve .
Method: Use the quadratic formula to find when height equals zero.
Identify the coefficients: , ,
This gives two solutions:
Since time cannot be negative in this context, we discard the negative solution.
Answer: The ball hits the ground at seconds.
Part b: Finding the maximum height
The maximum height occurs at the vertex of the parabola. Since , the parabola opens downward, confirming the vertex gives a maximum.
Step 1: Find the -coordinate of the vertex:
Step 2: Substitute into the function to find the maximum height:
Answer: At seconds, the maximum height is 7.10 metres.
Part c: Stating the domain and range
Domain: Time starts at zero and continues until the ball hits the ground at seconds. Therefore, the domain is .
Range: The ball starts at height 2 metres (), reaches a maximum of 7.10 metres at the vertex, then returns to height zero. Since , the parabola opens downward. Therefore, the range is .
Visual verification:
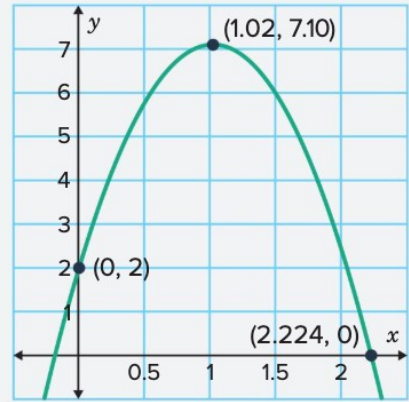
The parabola confirms our calculations, showing the motion from to , with the maximum at .
Optimisation with quadratic models
Quadratic functions are particularly useful for solving optimisation problems where you need to find maximum or minimum values. Common applications include maximising area, minimising cost, or maximising profit.
Break-even point
In business applications, a break-even point is the point at which income from production equals the cost of production. At this point, profit is zero.
To find break-even points, solve the equation where represents profit. The roots of the quadratic function indicate where profit changes from negative (loss) to positive (profit) or vice versa.
Worked example: profit optimisation
Worked Example: Maximizing Business Profit
Problem: A company's profit is modelled by , where is units sold (in hundreds) and is profit in thousands of dollars.
Part a: Finding break-even points
Break-even occurs when profit equals zero, so we solve .
Method: Use factorisation to find the roots.
Factor out :
Divide both sides by :
Factorise:
Using the null factor law:
Answer: The break-even points are at and , representing 500 and 1500 units respectively.
Part b: Finding maximum profit
The maximum profit occurs at the vertex of the parabola. Since , the parabola opens downward, so the vertex represents a maximum.
Step 1: Find the -coordinate of the vertex:
Step 2: Substitute into the function:
Answer: At (1000 units), the maximum profit is 50 thousand dollars ($50,000).
Part c: Stating the domain and range
Domain: Profit is non-negative between the break-even points. Therefore, the domain is .
Range: The profit ranges from zero (at the break-even points) to the maximum at the vertex. Since , the parabola opens downward with minimum at and maximum at 50. Therefore, the range is .
Visual verification:
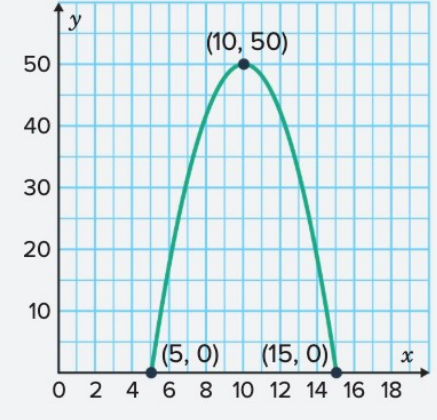
The graph confirms that profit is positive when , with the maximum at .
Exam tips
Common Mistakes to Avoid:
- Always check whether the context requires restrictions on the domain (e.g., time cannot be negative, physical dimensions must be positive)
- When finding maximum or minimum values, first check the sign of to determine whether the parabola opens upward or downward
- For break-even problems, remember that these occur where profit equals zero, not where profit is maximised
- Label your axes clearly on graphs and mark key points such as the vertex and intercepts
- Always express your final answer in the context of the problem (e.g., time in seconds, profit in dollars)
Key Points to Remember:
-
Quadratic functions model parabolic relationships such as projectile motion, area calculations, and profit analysis
-
Three forms serve different purposes: standard form for finding -intercepts and using the quadratic formula, vertex form for identifying maximum/minimum values, and factorised form for finding -intercepts
-
The vertex gives the optimal value: located at , it represents either the maximum (when ) or minimum (when ) value of the function
-
Domain depends on context: while mathematically unrestricted, real-world applications often require non-negative values or values within specific boundaries
-
Break-even points occur where profit equals zero: found by solving , these indicate the boundaries between profit and loss