Formulae for Correlation and Regression (HSC SSCE Mathematics Advanced): Revision Notes
Formulae for Correlation and Regression
Introduction
While technology is commonly used to calculate Pearson's correlation coefficient and the line of best fit, understanding the underlying formulae is essential in mathematics. This note presents the actual formulae for correlation and regression, helping you understand what happens "behind the scenes" when using technology.
The formulae are quite detailed and calculations can be time-consuming compared to finding means and standard deviations. However, working through examples by hand develops a deeper understanding of these statistical measures and helps you verify results from technology.
The formula for Pearson's correlation coefficient
Pearson's correlation coefficient is the standard measure of correlation. It tests specifically for linear correlation, meaning it measures how close data points are to lying on a straight line with a non-zero gradient.
The formula is:
Understanding the formula
Let's break down each component to understand what this formula is measuring:
Step 1: Calculate the means
First, calculate and , which are the means of the -values and -values respectively. The point will lie in the middle of the data cluster on the scatterplot.
Step 2: Find deviations from the mean
Calculate all the deviations from the mean:
- represents how far each -value is from the mean
- represents how far each -value is from the mean
Step 3: The numerator - products of deviations
The numerator involves the product for each data point. This is the key component because:
- If and both lie on the same side of their respective means, the product is positive
- If they lie on opposite sides, the product is negative
When we sum these products, we get a sense of whether the variables are working together (positive correlation) or working against each other (negative correlation).
Step 4: The denominator - normalisation
The denominator normalises the quantity and makes it a ratio. Importantly:
- The units of cancel out
- The units of cancel out
- The result is a pure number with no units
The denominator is closely related to the standard deviation formulae for and . In fact, the formula for can be rewritten using standard deviations, which provides an alternative computational approach.
Properties of Pearson's correlation coefficient
Critical Properties to Remember:
- is unaffected by units or changes in scale
- Changing metres to centimetres doesn't change
- Multiplying all -values by a constant (like ) doesn't change (except possibly the sign)
- Only the clustering of data points and the sign of the gradient affect the value of
Formulae for the regression line
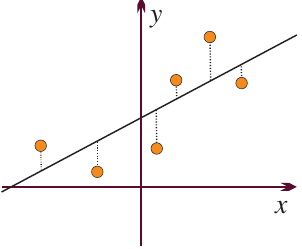
The least squares regression line is found by minimising the sum of the squares of the vertical distances from each data point to the line.
The regression line equation is:
where the gradient is:
and the -intercept is:
Key observations about the regression formulae:
Connection to correlation:
- The numerator of the gradient is the same as the numerator of
- The denominator of has already been calculated when finding
- Once you've calculated , finding the regression line is quick!
The -intercept:
- The value of ensures that the regression line passes through the point
- This is a useful check: the line of best fit always goes through the mean point
Worked example: Calculating correlation and regression
Let's work through a complete example using data about caller waiting times.
Worked Example: Calculating Correlation and Regression Line
Step 1: Set up the calculation table
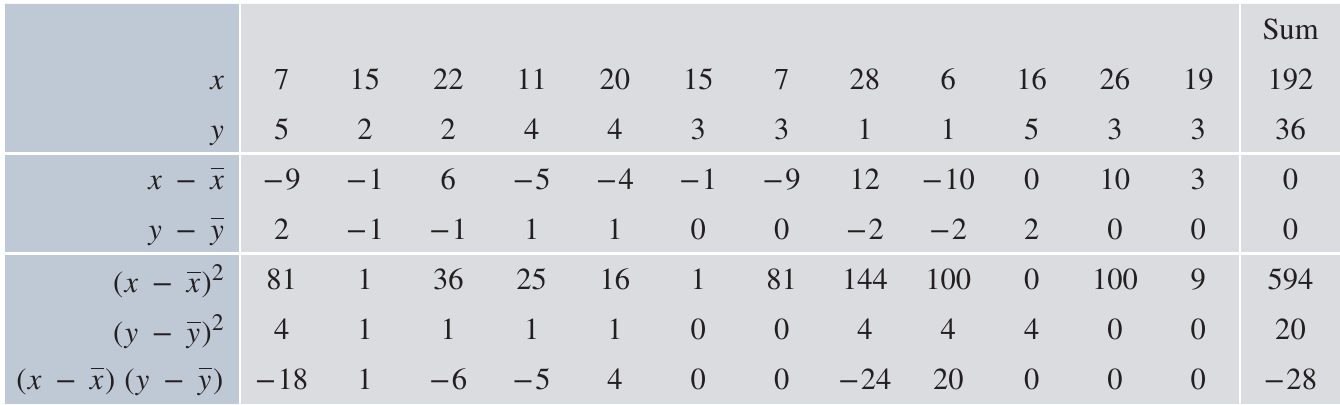
The table shows:
- Raw data: and values
- Deviations from the mean: and
- Squared deviations: and
- Products of deviations:
Step 2: Calculate the means
Step 3: Calculate Pearson's correlation coefficient
Using the formula:
Substituting the values from our table:
Step 4: Calculate the regression line
For the gradient:
For the -intercept:
Final Results:
- Correlation: (weak negative correlation)
- Line of best fit:
Classifying correlations
When describing correlation strength, we use verbal descriptions based on the value of . While there are no strict rules, the following classification provides helpful guidance.
For positive correlations (and similarly for negative correlations):
| Correlation | Classification |
|---|---|
| to | Strong |
| to | Moderate |
| to | Weak |
| to | Virtually none |
Important Points About Classification:
- These categories are suggestions, not fixed rules
- Different disciplines may use different criteria
- Always have the scatterplot available when interpreting correlation
- Be aware of any outliers that might affect the correlation
- Think about the context of the data and what makes sense
Example: In our caller waiting times example, indicates weak negative correlation. If an outlier were removed, the correlation becomes approximately , which would be classified as moderate negative correlation.
Key Formulae Summary
Pearson's correlation coefficient:
Least squares regression line: , where
and
Key Points to Remember:
- Pearson's correlation coefficient measures linear correlation and is always a pure number between and
- The numerator in the correlation formula involves products of deviations, showing whether variables work together or against each other
- The least squares regression line minimises the sum of squared vertical distances from points to the line
- The regression line always passes through the point
- Once you've calculated , finding the regression line is quick because both formulae share the same numerator
- Use the classification table as a guide, but always consider the scatterplot and context when interpreting correlation strength