Measures of Spread (HSC SSCE Mathematics Standard): Revision Notes
Measures of Spread
Understanding how data is distributed is crucial in statistics. While measures of centre (like mean and median) tell us where the middle of our data lies, measures of spread help us understand if data values are tightly grouped together or widely scattered. The three main measures of spread you need to know are range, interquartile range, and standard deviation.
Range
Range is the simplest way to measure how spread out your data is. It tells you the total span of your dataset by looking at the difference between your highest and lowest values.
Formula
Calculating range
Let's look at how to find the range using assessment results from two different tasks.
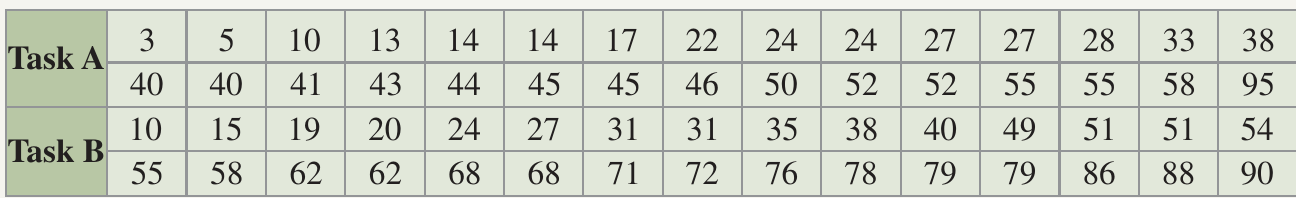
Worked Example: Calculating Range
For Task A:
- Highest score =
- Lowest score =
For Task B:
- Highest score =
- Lowest score =
Important limitation of range
The range for Task A () might seem to suggest the data is very spread out. However, this is misleading because the score of is an outlier – it's much higher than all the other scores.
Range can be heavily influenced by extreme values, which is why we need other measures of spread. Always check for outliers when using range. If you spot an extreme value, mention that the range might not be the best measure of spread for that dataset.
Quantiles
Quantiles are values that divide an ordered dataset into equal groups. They give us a more detailed picture of how data is distributed. The three main types you need to know are quartiles, deciles, and percentiles.
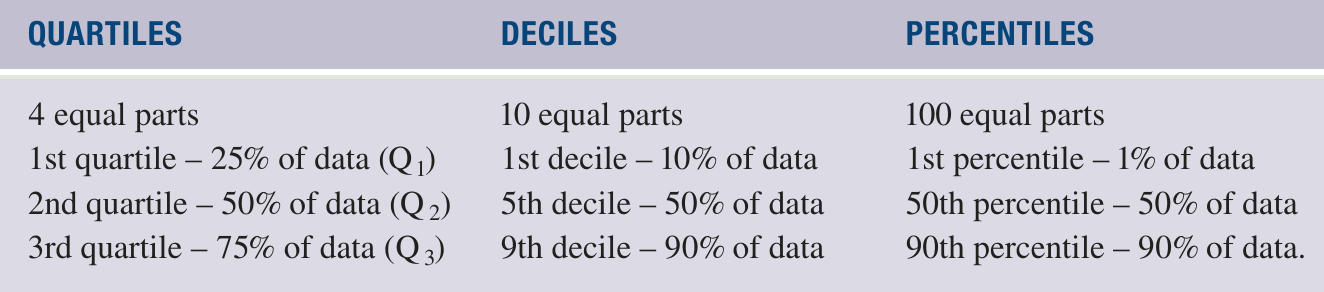
Understanding quartiles
Quartiles divide your data into four equal parts:
The Three Quartiles:
- First quartile (): The value below which 25% of your data falls
- Second quartile (): The median – 50% of data falls below this point
- Third quartile (): The value below which 75% of your data falls
Understanding deciles and percentiles
Deciles split data into ten equal parts. For example, the first decile marks the bottom 10% of data, while the ninth decile marks the bottom 90%.
Percentiles divide data into one hundred equal parts. The 50th percentile is the same as the median – it's the value where half your data sits below and half above.
Interquartile range (IQR)
The interquartile range is a more robust measure of spread than the simple range because it focuses on the middle 50% of your data, ignoring extreme values at either end.
Formula
Where:
- = Third quartile (75th percentile)
- = First quartile (25th percentile)
Steps to calculate IQR
- Arrange your data in increasing order
- Divide the data into two equal-sized groups (if you have an odd number of values, omit the median)
- Find by calculating the median of the first group
- Find by calculating the median of the second group
- Calculate IQR by subtracting from
Calculating IQR
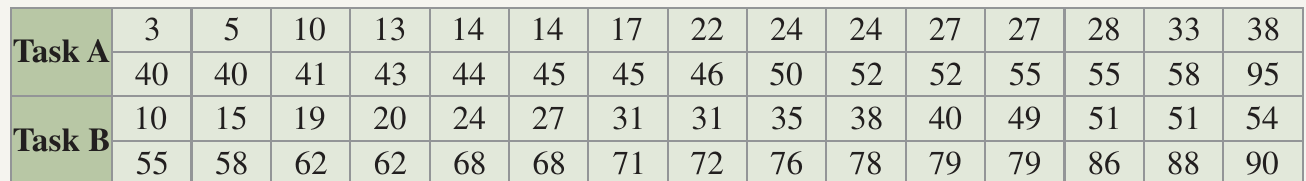
Let's use the same assessment data to calculate the interquartile range.
Worked Example: Calculating IQR
For Task A:
- Total scores: (so in each group)
- = median of first scores =
- = median of second scores =
For Task B:
- Total scores: (so in each group)
- = median of first scores =
- = median of second scores =
Interpreting IQR
A smaller IQR indicates that data is more consistent or tightly clustered. In our example, Task A has a smaller IQR () compared to Task B (), meaning Task A results are more consistent. Students performed more similarly to each other in Task A than in Task B.
When comparing datasets, always interpret what your IQR values mean in context. Don't just calculate – explain!
Standard deviation
Standard deviation is the most sophisticated measure of spread. It tells you how much your data values typically vary from the mean. A small standard deviation means data points cluster closely around the mean, while a large standard deviation indicates they're more scattered.
Two types of standard deviation
There are two slightly different ways to calculate standard deviation:
Population standard deviation ( or ):
- Use this when you have data for an entire population
- Divides by (the total number of values)
Sample standard deviation ( or ):
- Use this when you have a sample from a larger population
- Divides by (one less than the number of values)
- Generally gives a slightly larger value than population standard deviation
The sample standard deviation is more commonly used in practice because we usually work with samples rather than entire populations.
Calculating standard deviation
Your scientific calculator can calculate both types of standard deviation for you. Here's how to find them using the same assessment data.
Worked Example: Calculating Standard Deviation
For Task A:
- Enter statistics mode on your calculator
- Clear memory and input all data values
- Read the results:
- Population standard deviation:
- Sample standard deviation:
For Task B:
- Follow the same calculator steps
- Read the results:
- Population standard deviation:
- Sample standard deviation:
Task B has a higher standard deviation, confirming what we saw with the IQR – Task B results are more spread out than Task A.
Standard deviation with frequency data
Sometimes your data is presented in a frequency table. Let's see how to handle this.
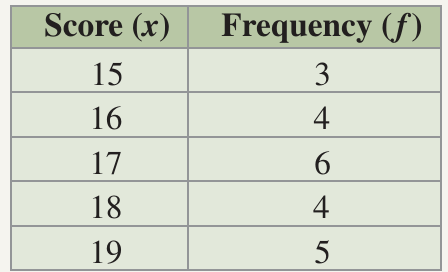
This frequency table shows customer numbers at a vegetable market over days. We want to find both types of standard deviation.
Worked Example: Standard Deviation with Frequency Data
- Enter statistics mode on your calculator
- Clear memory
- Enter each score along with its frequency:
- appears times
- appears times
- appears times
- appears times
- appears times
- Read the results:
- Population standard deviation:
- Sample standard deviation:
The standard deviations are quite small, indicating that customer numbers were fairly consistent across the days.
Make sure you know how to enter frequency data into your calculator. Practice this before the exam!
Key Points to Remember:
-
Range is quick to calculate but can be misleading when outliers are present. It simply shows the difference between your highest and lowest values.
-
Interquartile range (IQR) is more reliable than range because it focuses on the middle 50% of data. Calculate it by finding . A smaller IQR means more consistent data.
-
Quantiles help divide ordered data into equal groups. Remember: quartiles create parts, deciles create parts, and percentiles create parts.
-
Standard deviation measures spread around the mean. Use population standard deviation () for complete populations and sample standard deviation () for samples from larger populations.
-
Always interpret your results in context – don't just calculate numbers, explain what they mean for your dataset!