Investment Graphs (HSC SSCE Mathematics Standard): Revision Notes
Investment Graphs
Simple interest graphs
When you invest money with simple interest, the interest earned grows at a constant rate. This means that each year (or time period), you earn exactly the same amount of interest. When we graph this relationship, it creates a straight line.
To create a simple interest graph, you place the time period () on the horizontal axis and the interest earned () on the vertical axis. Because the interest increases by the same amount each period, the graph will be linear (a straight line).
Simple interest graphs always produce a straight line because the interest earned remains constant for each time period. This makes them easy to predict and calculate!
Steps to construct a simple interest graph
Follow these three steps to draw a simple interest graph:
- Construct a table of values for and using the simple interest formula
- Draw a number plane with on the horizontal axis and on the vertical axis, then plot the points
- Join the points to make a straight line
Worked Example: Constructing a Simple Interest Graph
Question: Draw a graph showing the amount of simple interest earned over a period of 10 years if $1000 is invested at 8% p.a. Use the graph to estimate the interest earned after 7.5 years.
Solution:
Step 1: Write the simple interest formula
Step 2: Substitute , and into the formula
Step 3: Draw a table of values for and
Step 4: Let and find the interest () using
| 0 | 2 | 4 | 6 | 8 | 10 | |
|---|---|---|---|---|---|---|
| 0 | 160 | 320 | 480 | 640 | 800 |
Step 5: Draw a number plane with as the horizontal axis and as the vertical axis
Step 6: Plot the points , , , , and
Step 7: Draw a straight line between the points (simple interest graphs are linear)
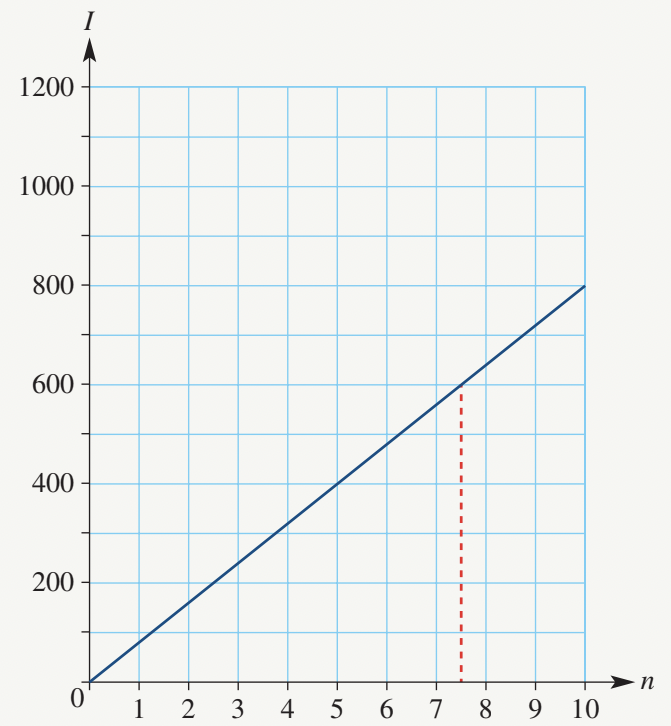
Step 8: Read the graph to estimate when
From the graph, when
Step 9: Write the answer in words
Interest after 7.5 years is approximately $600.
Compound interest graphs
When you invest money with compound interest, the interest earned increases at an accelerating rate. This is because you earn interest not only on your original investment but also on the interest that has already been added. Each time period, the amount of interest earned gets larger.
To create a compound interest graph, you place the compounding time periods () on the horizontal axis and the interest earned () on the vertical axis. Because the interest increases by different amounts each period, the graph will be an exponential curve, not a straight line.
Unlike simple interest, compound interest graphs form a J-shaped curve that gets steeper over time. This reflects the accelerating growth as you earn "interest on interest"!
Steps to construct a compound interest graph
Follow these three steps to draw a compound interest graph:
- Construct a table of values for and using the compound interest formula
- Draw a number plane with on the horizontal axis and on the vertical axis, then plot the points
- Join the points to make an exponential curve
Worked Example: Constructing a Compound Interest Graph
Question: Draw a graph showing the interest earned over a period of 10 years if $1000 is invested at a compound interest rate of 8% p.a. Use the graph to estimate the interest earned after 7.5 years.
Solution:
Step 1: Write the future value and interest earned formulas
Step 2: Substitute , and into the formulas
Step 3: Draw a table of values for , and
Step 4: Let and find the future value and interest earned
| 0 | 2 | 4 | 6 | 8 | 10 | |
|---|---|---|---|---|---|---|
| 1000 | 1166 | 1360 | 1587 | 1851 | 2159 | |
| 0 | 166 | 360 | 587 | 851 | 1159 |
Step 5: Draw a number plane with as the horizontal axis and as the vertical axis
Step 6: Plot the points , , , , and
Step 7: Draw an exponential curve (not a straight line) between the points
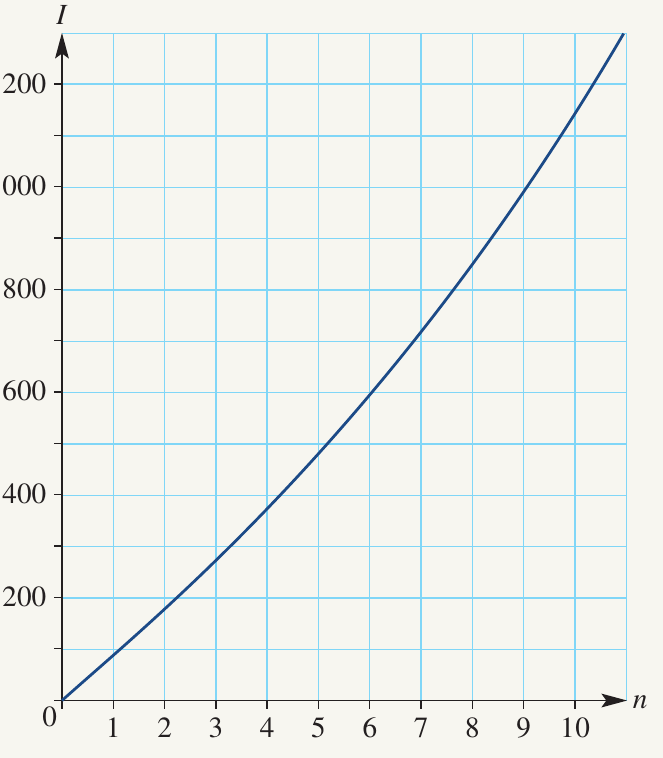
From the graph, when
Step 9: Write the answer in words
Interest after 7.5 years is about $780.
Key differences between the graphs
Comparing the two worked examples above, you can see that:
- Both investments started with $1000 at 8% p.a.
- After 7.5 years, simple interest earned approximately $600
- After 7.5 years, compound interest earned approximately $780
- The simple interest graph is a straight line (linear)
- The compound interest graph is a curve that gets steeper over time (exponential)
- Compound interest earns more because interest is calculated on the growing total, not just the original principal
Common Mistake to Avoid:
Students often confuse which type of graph to draw! Remember:
- Simple = Straight (constant increase each period)
- Compound = Curve (accelerating increase each period)
Always check the question carefully to identify which type of interest is being used.
Exam tip
When constructing investment graphs, always remember to label your axes clearly. The horizontal axis should show the time period () and the vertical axis should show the interest earned (). Make sure you know which type of graph to draw: simple interest produces a straight line, while compound interest produces an exponential curve.
Remember!
Key Points to Remember:
-
Simple interest graphs are linear: They form a straight line because interest increases by the same amount each period
-
Compound interest graphs are exponential: They form a curve that gets steeper over time because interest is earned on both principal and accumulated interest
-
Axis labels are important: Always put time period () on the horizontal axis and interest earned () on the vertical axis
-
Use the correct formula: Simple interest uses , while compound interest uses
-
Compound interest grows faster: Over the same time period at the same interest rate, compound interest will always earn more than simple interest