Simultaneous Linear Equations (HSC SSCE Mathematics Standard): Revision Notes
Break-Even Analysis
What is break-even analysis?
A business reaches its break-even point when the money it spends (costs) equals the money it earns (income). At this exact point, there is no profit and no loss.
Understanding break-even analysis helps businesses determine:
- How many items they need to sell to cover all their costs
- When they will start making a profit
- How much loss they will make if they sell too few items
For example, if a business breaks even at 100 items per month:
- Selling fewer than 100 items results in a loss
- Selling more than 100 items results in a profit
- Selling exactly 100 items means no profit or loss
Essential formulas
Break-even analysis uses three key formulas that work together to show the financial position of a business.
Profit formula:
The profit (or loss) is calculated by subtracting total costs from total income:
Income formula:
Total income is represented as a linear equation:
Where:
- = total income (in dollars)
- = selling price per item
- = number of items sold
Cost formula:
Total costs are represented as a linear equation:
Where:
- = total costs (in dollars)
- = cost to produce each item
- = number of items produced
- = fixed costs (costs that don't change with production)
Key point: At the break-even point, income equals costs (), which means profit equals zero.
Understanding break-even graphs
Break-even analysis can be visualised using a graph that shows both the income line and the cost line. The point where these two lines cross is the break-even point.
Features of a break-even graph:
- The horizontal axis shows the number of items ()
- The vertical axis shows dollars ($)
- The income line typically starts at the origin (0, 0)
- The cost line starts at the fixed costs value ()
- The intersection point shows the break-even quantity
Profit and loss zones:
- Loss zone: The area where the cost line is above the income line (before break-even)
- Profit zone: The area where the income line is above the cost line (after break-even)
Worked Example: Reading a Break-Even Graph
Grace buys and sells wallets. Her income from selling wallets follows the formula , and her costs follow the formula .
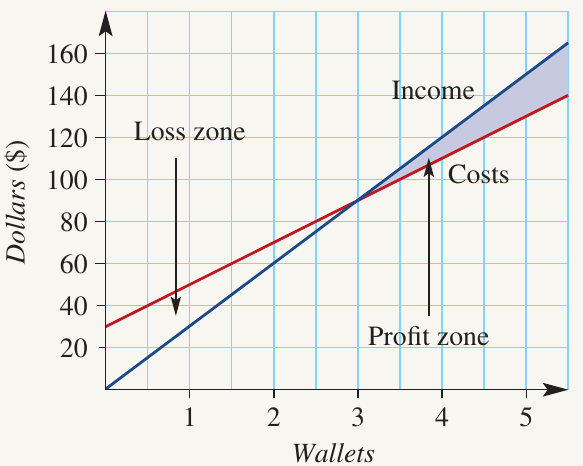
Question: Using the graph, determine:
- How many wallets Grace needs to sell to break even
- Her profit or loss when four wallets are sold
Solution:
Part a) Finding the break-even point
The break-even point occurs when income equals costs. This happens at the point where the two lines intersect.
Reading from the graph:
- The intersection point is at (3, 90)
- This means
- Grace needs to sell 3 wallets to break even
Part b) Finding profit when 4 wallets are sold
To find the profit, we use the formula:
Reading from the graph when :
- Income: dollars
- Costs: dollars
Calculating the profit:
Grace makes a profit of $10 when she sells 4 wallets.
Finding the break-even point algebraically
While graphs provide a visual way to find the break-even point, we can also solve break-even problems algebraically. This method is more accurate and doesn't rely on estimating values from a graph.
The algebraic method is particularly useful when you need an exact answer or when the break-even point falls between grid lines on a graph.
Steps for finding the break-even point
1. Set up the income equation
- Identify the selling price per unit
- Write the equation
- Determine the gradient () and vertical intercept
2. Set up the cost equation
- Identify the cost per unit and fixed costs
- Write the equation
- Determine the gradient () and vertical intercept ()
3. Create the graph
- Draw axes with (number of units) horizontal and dollars vertical
- Sketch the income line using its gradient and intercept
- Sketch the cost line using its gradient and intercept
- Mark the intersection point
4. Verify algebraically
- Substitute the -value from the intersection into both equations
- Calculate the income and costs separately
- Check that both values are equal
Worked Example: Complete Break-Even Analysis
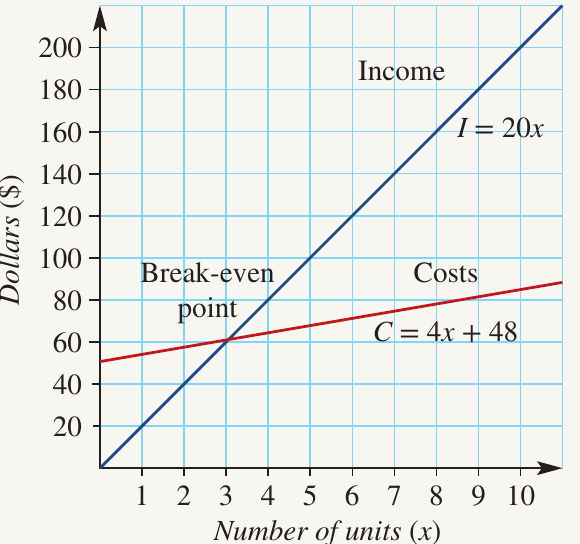
A firm sells its product at $20 per unit. The cost of production is given by , where is the number of units produced.
Question: Find the value of for which the cost of production equals the income received, and verify the answer algebraically.
Solution:
Setting up the income equation:
The income formula is:
- Gradient: 20
- Vertical intercept: 0
Setting up the cost equation:
The cost formula is given as:
- Gradient: 4
- Vertical intercept: 48
Creating the graph:
To sketch the lines:
- Plot starting at the origin (0, 0) with a gradient of 20
- Check with a point: when ,
- Plot starting at (0, 48) with a gradient of 4
- Check with a point: when ,
Reading the break-even point:
The two lines intersect when .
This is the break-even point where the cost of production equals income.
Algebraic verification:
To check this answer, substitute into both equations:
Income:
Costs:
Since income equals costs ($60 = $60), the break-even point is confirmed at 3 units.
Exam tips
Tips for Success:
- Always clearly label your axes on break-even graphs
- Show both the income and cost lines distinctly
- Mark the break-even point clearly on your graph
- Check your graphical answer algebraically when possible
- Remember that profit can be negative (which means a loss)
- Read graph values carefully at the specified -value
Common Mistakes to Avoid:
- Confusing which line is income and which is costs
- Forgetting to include fixed costs in the cost equation
- Reading the wrong coordinate from the intersection point
- Not showing all steps in algebraic verification
Remember!
Key Points to Remember:
- Break-even occurs when costs equal income - there is no profit or loss at this point
- Three key formulas: Profit = Income - Costs, Income = , Costs =
- The break-even point is found at the intersection of the income and cost lines on a graph
- Below break-even is the loss zone, above break-even is the profit zone
- Always verify graphical answers algebraically by substituting the -value into both equations and checking they give the same result