The Normal Distribution (HSC SSCE Mathematics Standard): Revision Notes
Further Applications of Normal Distributions
Introduction to normal distributions
In a normal distribution, the mean, mode, and median all have the same value. This type of distribution is perfectly symmetrical around the mean, creating the characteristic bell-shaped curve.
A normal distribution has three key properties:
- The mean, mode, and median are all equal
- The distribution is perfectly symmetrical about the mean
- The data follows a predictable pattern described by the empirical rule
A key feature of normal distributions is that the proportion of data values within specific ranges of standard deviations from the mean follows a consistent pattern. This is known as the empirical rule or the 68-95-99.7 rule.
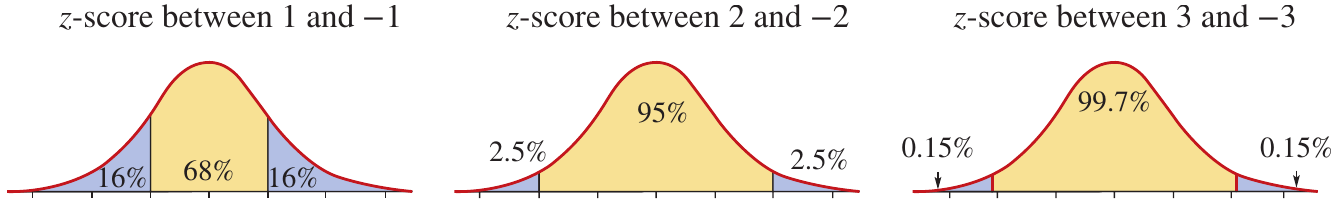
The 68-95-99.7 rule
The empirical rule tells us that in any normal distribution:
- Approximately 68% of all values have a z-score between and (within one standard deviation of the mean)
- Approximately 95% of all values have a z-score between and (within two standard deviations of the mean)
- Approximately 99.7% of all values have a z-score between and (within three standard deviations of the mean)
These percentages can be interpreted as:
- 68% of values are mostly in this range
- 95% of values are very probably in this range
- 99.7% of values are almost certainly in this range
The 68-95-99.7 rule applies to all normal distributions, regardless of their specific mean or standard deviation values. This makes it an incredibly powerful tool for quick probability estimates.
Understanding z-scores and symmetry
The z-score measures how many standard deviations a particular value is from the mean. The formula for calculating a z-score is:
Where:
- is the data value
- is the mean
- is the standard deviation
Because normal distributions are symmetrical, the percentages on either side of the mean are equal. This symmetry is extremely useful when calculating probabilities and percentages.
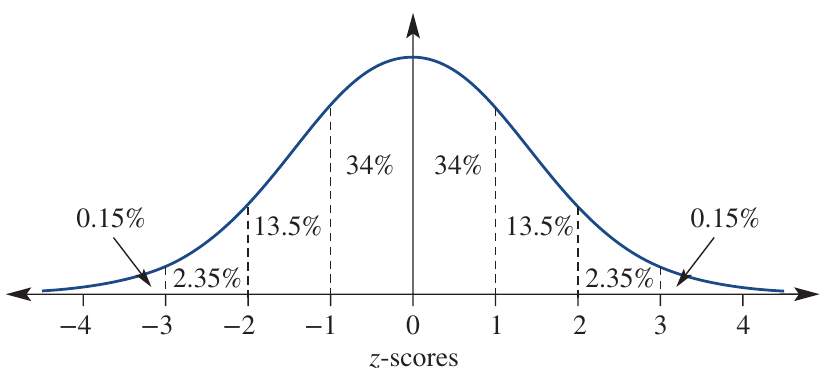
Detailed percentage breakdown in a normal distribution:
The diagram above shows how the percentages break down in more detail:
- 34% of values fall between the mean and one standard deviation on either side
- 13.5% fall between one and two standard deviations on either side
- 2.35% fall between two and three standard deviations on either side
- 0.15% fall beyond three standard deviations on either side
Understanding these specific percentages allows you to calculate probabilities for any range within the distribution.
Worked example 1: Finding percentages within a range
Worked Example: Heights of Children
Question: The heights of children are normally distributed with a mean of cm and a standard deviation of cm. What percentage of children have heights between cm and cm?
Solution:
We need to find the z-scores for both boundary values.
For the lower boundary ( cm):
For the upper boundary ( cm):
The heights between cm and cm correspond to z-scores between and . According to the 68-95-99.7 rule, 68% of values fall within this range.
Answer: 68% of children have heights between 145 cm and 155 cm.
Worked example 2: Advanced applications
Worked Example: Mass of Jam Jars
Question: The mass of jars of jam is normally distributed with a mean of grams and a standard deviation of grams.
a) What percentage of the jars have a mass:
- i) more than grams?
- ii) less than grams?
b) What percentage of jars are predicted to have a mass between and grams?

Solution:
Part a(i): Finding the percentage more than 426 grams
First, calculate the z-score for grams:
The z-score of tells us that grams is two standard deviations above the mean.
According to the 68-95-99.7 rule, 95% of values fall between z-scores of and . This means:
Percentage outside this range
Due to symmetry, half of this 5% is above a z-score of , and half is below .
Answer: 2.5% of jars have a mass more than 426 grams.
Part a(ii): Finding the percentage less than 423 grams
Calculate the z-score for grams:
The z-score of means grams is one standard deviation above the mean.
From the 68-95-99.7 rule, 68% of values fall between z-scores of and . Due to symmetry, half of this percentage falls between the mean (z-score of ) and a z-score of :
This 34% represents values between the mean and grams.
Since 50% of values fall below the mean, we add:
Answer: 84% of jars have a mass less than 423 grams.
Part b: Finding the percentage between 414 and 429 grams
Calculate the z-score for grams:
Calculate the z-score for grams:
We need the percentage of values between z-scores of and .
From the mean to a z-score of (using symmetry):
From the mean to a z-score of (using symmetry):
Total percentage between and :
Answer: 97.35% of jars are predicted to have a mass between 414 and 429 grams.
Exam tips
Essential Tips for Normal Distribution Problems:
- Always start by calculating z-scores using the formula
- Remember that the normal distribution is symmetrical - percentages on each side of the mean are equal
- When finding percentages outside a range, subtract from 100% and divide by 2
- Use the detailed percentage breakdowns (34%, 13.5%, etc.) when working with ranges that don't align perfectly with , , or standard deviations
- Draw a sketch of the normal curve and mark your z-scores to visualise the problem
- The 68-95-99.7 rule applies to all normal distributions, regardless of the actual mean and standard deviation values
Remember!
Key Points to Remember:
- In a normal distribution, the mean, mode, and median are all equal, and the distribution is perfectly symmetrical around the mean
- The 68-95-99.7 rule states that approximately 68% of values fall within one standard deviation, 95% within two standard deviations, and 99.7% within three standard deviations of the mean
- Calculate z-scores using the formula to determine how many standard deviations a value is from the mean
- Symmetry allows you to find percentages on either side of the mean by dividing the total percentages in half
- For values outside a specific range, subtract the percentage inside from 100% and use symmetry to find the percentage on each tail