Normally Distributed Data (HSC SSCE Mathematics Standard): Revision Notes
Normally Distributed Data
What is a normal distribution?
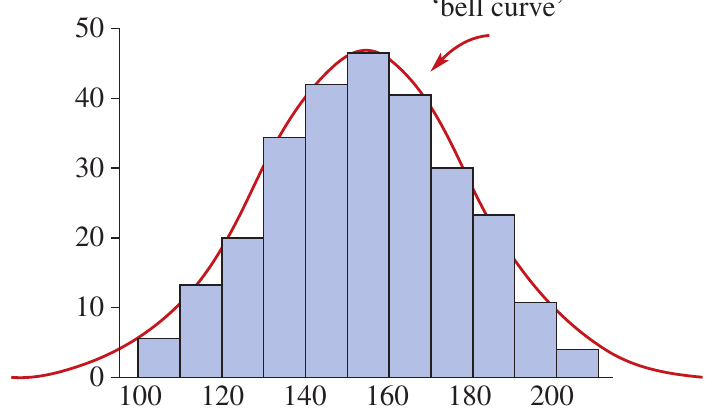
A normal distribution is a special type of data distribution where values are spread symmetrically around a central point. The graph of a normal distribution creates a distinctive shape known as a bell curve (or normal curve) because it resembles the shape of a bell.
In a normal distribution, three important measures of central tendency are all equal:
- Mean (the average)
- Median (the middle value)
- Mode (the most frequently occurring value)
The distribution is perfectly symmetrical about the mean, meaning the left and right sides of the curve are mirror images of each other.
This equality of mean, median, and mode is a defining characteristic that helps us identify normally distributed data in real-world situations.
Mean and median in a normal distribution
Understanding the mean
The mean represents the central value of a dataset. You calculate it by adding all the values together and dividing by the total number of values.
where is the sum of all values and is the number of values.
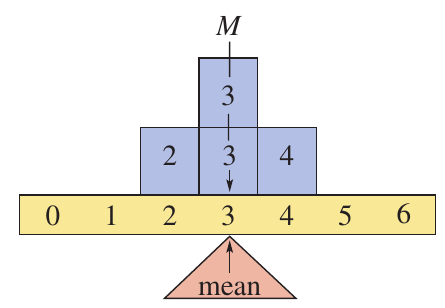
Most people refer to the mean as the "average". It represents the balance point of the distribution - imagine balancing a ruler on your finger; the mean is where it would balance perfectly.
Understanding the median
The median is the middle value when all scores are arranged in order from smallest to largest. To find the median:
- List all values in increasing order
- Select the middle value
- If there are two middle values, find their average
Comparing normal and skewed distributions
For normally distributed data, the mean and median are approximately equal. This tells us the data is balanced around the centre.
Worked Example: Normal Distribution
Consider the dataset:
Data ordered:
Median
Here, both the mean and median equal . Notice that there are two data points to the left of the mean and two to the right. This equal distribution on both sides is characteristic of normal distributions.
Worked Example: Skewed Distribution
Consider the dataset:
Data ordered:
Median
This data is skewed because the mean () does not equal the median (). The unusually large value of pulls the mean higher, but the median remains unaffected.
The mean is sensitive to extreme values, while the median is more resistant to them. This difference is crucial for identifying whether data is normally distributed or skewed.
Characteristics of a normal distribution
The normal distribution is one of the most significant distributions in statistics. Many real-world datasets naturally form approximately symmetrical, bell-shaped patterns.
Real-world examples
Normal distributions appear frequently in biological and physical measurements:
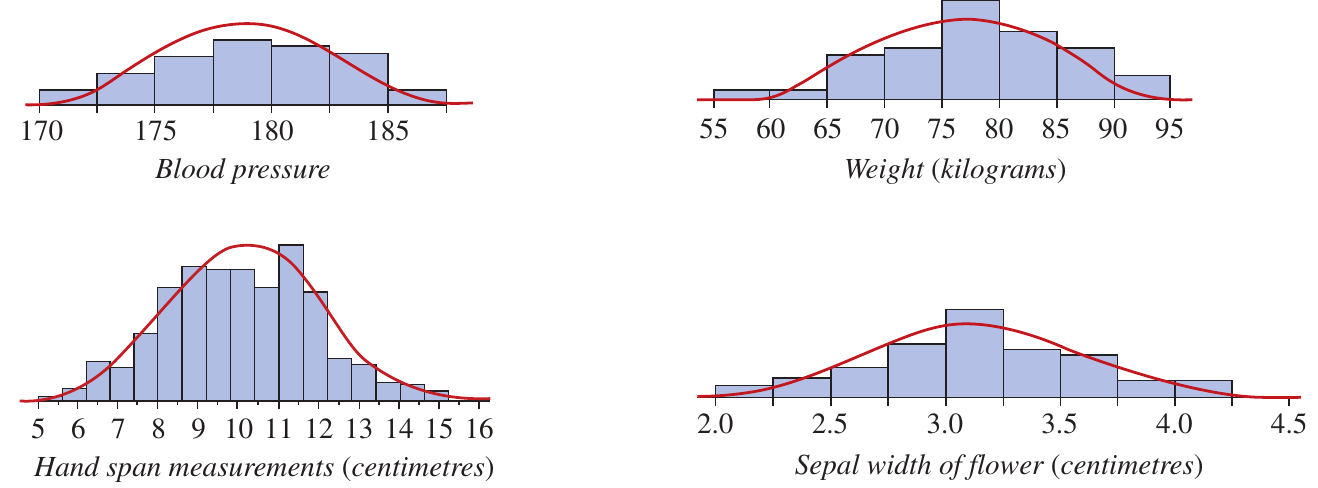
These examples include:
- Blood pressure measurements
- Body weight in kilograms
- Hand span measurements in centimetres
- Sepal width of flowers in centimetres
These biological and physical measurements tend to cluster around an average value, with fewer observations at the extremes, creating the characteristic bell shape we associate with normal distributions.
Different normal distributions
Normal distributions can vary in their mean (centre position) and standard deviation (spread). Some distributions are tall and narrow, indicating less variability, while others are short and wide, showing greater variability. However, all normal distributions share the same fundamental bell shape and symmetry.
Five key characteristics
Every normal distribution possesses these five important features:
- Symmetry: The distribution is symmetrical about the mean. The left and right halves are mirror images.
- Equal measures of centre: The mean, median, and mode are all equal to each other.
- Central concentration: Most data values cluster around the centre, with fewer values appearing in the tails (extremes).
- Asymptotic tails: The curve approaches, but never touches, the horizontal axis at both ends. This means theoretically, extreme values are possible but increasingly unlikely.
- Defined by parameters: The shape and position of a normal distribution are completely determined by two values: the mean and the standard deviation of the dataset.
Common Misconception Alert
Many students think the normal curve actually touches the horizontal axis at some point. In reality, the tails extend infinitely, getting closer and closer to the axis but never quite reaching it. This is what we mean by "asymptotic".
Worked example: Creating a bell-shaped curve
Let's work through a complete example showing how to represent normally distributed data.
Worked Example: Analyzing Women's Heights
Problem: The heights (in cm) of 11 women are:
Part A: Construct a frequency table
Create a table with three columns: Score, Tally, and Frequency.
Steps:
- List each unique height value in the Score column
- Use tally marks to count occurrences of each height
- Write the total count in the Frequency column
The frequency table shows:
| Score | Tally | Frequency |
|---|---|---|
| 163 | I | 1 |
| 164 | I | 1 |
| 165 | II | 2 |
| 166 | III | 3 |
| 167 | II | 2 |
| 168 | I | 1 |
| 169 | I | 1 |
Part B: Find the mean and median
Calculate the mean:
Find the median:
Write the scores in order:
Count the total number of scores: there are scores
The median is the middle value, which is the 6th score
Median
Notice that the mean and median are equal, confirming this is normally distributed data.
Part C: Calculate the standard deviation
Using a calculator in statistics mode, enter all the data values.
Population standard deviation (correct to two decimal places)
Part D: Draw a dot plot and bell-shaped curve
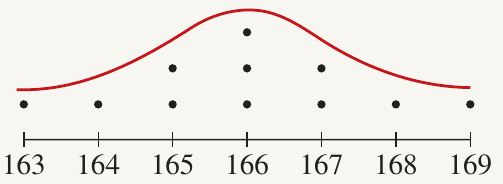
Steps:
- Draw a horizontal number line covering the range of data values ( to )
- Plot each data value as a dot above its position on the number line
- Stack multiple dots vertically when values repeat
- Draw a smooth bell-shaped curve that follows the pattern of the dots
The resulting graph shows the characteristic bell shape of a normal distribution, with the peak at the mean value of 166 and symmetry on both sides.
Key Points to Remember:
-
A normal distribution creates a bell-shaped curve that is symmetrical about the mean.
-
In a normal distribution, the mean, median, and mode are all equal, indicating perfect balance in the data.
-
Most data values cluster near the centre, with fewer values in the tails, creating the characteristic bell shape.
-
Real-world examples of normally distributed data include biological measurements like height, weight, and blood pressure.
-
The mean is affected by extreme values (outliers), while the median remains stable, which helps identify whether data is normally distributed or skewed.