The 68–95–99.7 Rule (HSC SSCE Mathematics Standard): Revision Notes
The 68–95–99.7 Rule
What is the 68–95–99.7 rule?
When data follows a normal distribution pattern, it creates a beautiful bell-shaped curve that's perfectly symmetrical. This symmetry means the mean, median, and mode all sit at the same central point. One of the most useful features of this distribution is that we can predict exactly what proportion of data falls within certain distances from the mean.
The 68–95–99.7 rule (sometimes called the empirical rule) tells us that for any normal distribution:
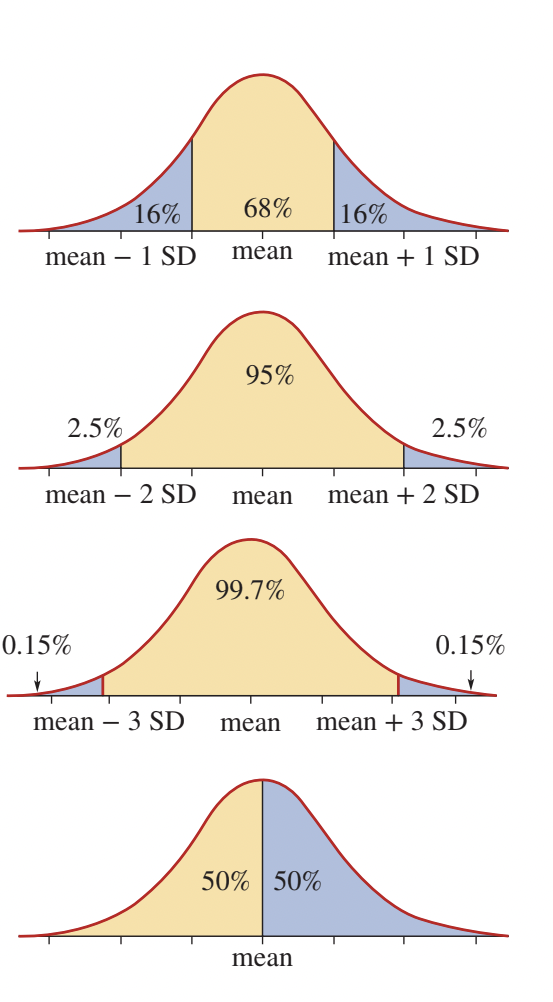
- Approximately 68% of all data values lie within one standard deviation of the mean
- Approximately 95% of all data values lie within two standard deviations of the mean
- Approximately 99.7% of all data values lie within three standard deviations of the mean
Additionally, because of the symmetry:
- 50% of data lie above the mean
- 50% of data lie below the mean
The beauty of the 68-95-99.7 rule is its universality—it works for any normal distribution, whether you're measuring test scores, heights, delivery times, or any other naturally occurring phenomenon that follows a normal pattern. The actual mean and standard deviation values don't matter; the percentages always remain the same.
Understanding standard deviations and ranges
To use this rule effectively, you need to calculate the boundaries for each range. The formula is straightforward:
Lower boundary =
Upper boundary =
where is the number of standard deviations (1, 2, or 3).
The three key ranges
Understanding what happens at each standard deviation level is crucial for applying this rule:
Within 1 standard deviation ():
- Contains approximately 68% of data
- This means 32% lie outside this range
- Due to symmetry, 16% lie in each tail (below and above)
Within 2 standard deviations ():
- Contains approximately 95% of data
- This means 5% lie outside this range
- Due to symmetry, 2.5% lie in each tail
Within 3 standard deviations ():
- Contains approximately 99.7% of data
- This means 0.3% lie outside this range
- Due to symmetry, 0.15% lie in each tail
Understanding the Tails
A common mistake is forgetting that the percentages outside each range are split equally between both tails. For example, if 32% of data lie outside one standard deviation, that's 16% in the left tail (below the mean) and 16% in the right tail (above the mean). Always consider whether you need the percentage in one tail or both tails combined.
Visual representation
How to apply the rule: worked examples
Worked Example 1: Finding ranges from mean and standard deviation
Question: A normal distribution of test scores has a mean of 75 and standard deviation of 5. Find:
- Where 50% of scores lie above
- The range containing 68% of scores
- The range containing 95% of scores
- The range containing 99.7% of scores
Solution:
Part a: Where do 50% of scores lie above?
The normal distribution is symmetrical about the mean. Therefore, 50% of scores lie above 75.
50% lie above 75
Part b: What range contains 68% of scores?
68% of scores lie within one SD of the mean:
- Lower boundary:
- Upper boundary:
68% lie between 70 and 80
Part c: What range contains 95% of scores?
95% of scores lie within two SDs of the mean:
- Lower boundary:
- Upper boundary:
95% lie between 65 and 85
Part d: What range contains 99.7% of scores?
99.7% of scores lie within three SDs of the mean:
- Lower boundary:
- Upper boundary:
99.7% lie between 60 and 90
Worked Example 2: Disease recovery times
Question: For a certain disease, the mean recovery time is 12 days with a standard deviation of 2 days. The distribution is approximately normal.
- How long would it take for half the patients to recover?
- What percentage of patients recover within 8 to 16 days?
- What percentage of patients recover within 10 days?
- If 400 patients contracted the disease, how many recovered within 16 days?
Solution:
Part a: Half the patients
Since the distribution is symmetrical about the mean, 50% of patients recover within 12 days or less. Therefore, half the patients recover in 12 days or less.
Part b: Recovery within 8 to 16 days
First, determine how many SDs these values are from the mean:
- days (two SDs below mean)
- days (two SDs above mean)
The range 8 to 16 days represents two SDs either side of the mean. According to the rule, 95% of data lie within two SDs.
95% of patients recover within 8 to 16 days
Part c: Recovery within 10 days
Determine how many SDs from the mean: days
This is one SD below the mean. From the rule, 16% of data lie below one SD from the mean.
16% of patients recover within 10 days
Part d: Number recovering within 16 days
We know 16 days is two SDs above the mean. The percentage beyond two SDs above the mean is 2.5%.
Therefore, of patients recover within 16 days.
Calculate the number:
390 patients recover within 16 days
Worked Example 3: Pizza delivery times
Question: House of Pizza has delivery times that are approximately normally distributed with a mean of 25 minutes and standard deviation of 5 minutes.
- What percentage of pizzas are delivered between 15 and 35 minutes?
- What percentage take more than 30 minutes?
- If 2000 pizzas are delivered in a month, how many arrive in less than 10 minutes?
Solution:
Part a: Deliveries between 15 and 35 minutes
Calculate the boundaries in terms of SDs:
- minutes (two SDs below mean)
- minutes (two SDs above mean)
This range represents two SDs either side of the mean. From the rule, 95% of values lie within two SDs.
95% of pizzas are delivered between 15 and 35 minutes
Part b: Deliveries taking more than 30 minutes
Calculate: minutes
This is one SD above the mean. From the rule, 16% of data lie beyond one SD above the mean.
16% of pizzas take more than 30 minutes
Part c: Deliveries in less than 10 minutes
Calculate: minutes
This is three SDs below the mean. From the rule, 0.15% of data lie beyond three SDs below the mean.
Number of pizzas:
3 pizzas are delivered in less than 10 minutes
Exam Tips and Common Pitfalls
-
Always draw a diagram when working with the 68-95-99.7 rule. Sketch a normal curve, mark the mean, and shade the region you're interested in. This visual aid helps prevent errors.
-
Check which side of the mean you're working with. Questions asking "less than" or "below" refer to the left tail, while "more than" or "above" refer to the right tail.
-
Remember the tail percentages: Beyond 1 SD = 16%, beyond 2 SD = 2.5%, beyond 3 SD = 0.15%. These are frequently needed in questions.
-
Use symmetry to your advantage. If you know the percentage on one side, you automatically know the percentage on the other side.
-
Calculate boundaries first before trying to determine percentages. Write out the calculation showing mean ± (number of SDs × SD value).
Key Points to Remember:
-
The 68-95-99.7 rule applies to all normal distributions, regardless of the actual mean and standard deviation values
-
Approximately 68% of data fall within 1 SD, 95% within 2 SD, and 99.7% within 3 SD of the mean
-
The normal distribution is perfectly symmetrical, so 50% of data lie above the mean and 50% below
-
Tail percentages are: 16% beyond ±1 SD, 2.5% beyond ±2 SD, and 0.15% beyond ±3 SD
-
Always calculate the actual boundary values (mean ± number of SDs × SD) before determining what percentage of data falls in a particular range
-
Drawing a diagram is your best friend when solving these problems—it helps visualize the distribution and prevents calculation errors