Features of Stellar Spectra – Classifying Stars (HSC SSCE Physics): Revision Notes
Features of Stellar Spectra – Classifying Stars
Introduction to stellar classification
The classification of stars by their spectra began long before astronomers fully understood how the patterns in a spectrum relate to a star's surface temperature. In 1814, Joseph Fraunhofer made careful observations of hundreds of absorption lines in the Sun's spectrum. These absorption lines are now called Fraunhofer lines in his honour. This pioneering work laid the foundation for how we classify stars today.
Fraunhofer's discovery of absorption lines in the solar spectrum was revolutionary because it provided the first evidence that stars have specific chemical compositions. His systematic cataloging of these lines created a framework that astronomers would build upon for over a century.
When astronomers classify a star, they examine several key features of its spectrum. These include the appearance and intensity of spectral lines, the width of certain absorption lines, and the wavelength at which peak intensity occurs. By analyzing these features, astronomers can determine important properties of stars, including their surface temperature and composition.
Spectral class and surface temperature
Understanding the color-temperature relationship
The apparent colour of a star is directly determined by its surface temperature. This relationship follows the principles of blackbody radiation and Wien's Displacement Law:
where m K
Cooler stars appear red, while hotter stars appear blue or white. The diagram below shows how star color changes with surface temperature:
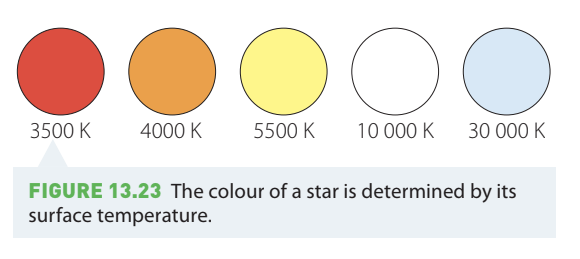
Stars with surface temperatures around 3500 K appear red, while those at 30,000 K appear light blue. Our Sun, with a surface temperature of approximately 5500 K, appears yellow. This color-temperature relationship is fundamental to understanding stellar classification.
Balmer series absorption lines
One of the most important features used to classify stars is the pattern of Balmer series absorption lines in their spectra. These are absorption lines caused by hydrogen atoms in the star's atmosphere. The strength of these lines varies significantly with temperature.
The strongest Balmer series absorption lines occur in stars with surface temperatures around 10,000 K (spectral class A). These stars appear white. However, both cooler and hotter stars show weaker Balmer lines:
- Cool red stars (spectral type M, below 3500 K) exhibit very weak Balmer series lines
- Very hot stars (spectral type O, above 20,000 K) have no discernible Balmer series lines
Why do the hottest stars lack hydrogen lines? The reason is ionization. At temperatures above 20,000 K, hydrogen becomes completely ionized. This means the atomic electrons responsible for producing hydrogen absorption lines have been stripped away from the proton (nucleus). Without electrons to absorb specific wavelengths of light, no Balmer lines appear in the spectrum.
This is a crucial concept: the absence of certain lines tells us as much about a star as their presence does.
Development of the classification system
The Harvard classification
The spectral classification system we use today was developed primarily at Harvard University between 1918 and 1924. The most significant contributor to this work was Annie Jump Cannon (1863–1941), a university-educated astronomer and physicist.
Cannon was employed at Harvard University, along with several other women, to catalogue stars from photographs. Over her remarkable 43-year career, she became a highly respected astronomer whose stellar classification work was published annually. Her achievements include:
- Classifying over 225,000 stars
- Discovering 300 variable stars
- Discovering five novae
- Working at an impressive rate of three star classifications per minute
When Cannon and her colleagues organized the classification system, they simplified the original scheme to eliminate overlapping and confusing categories. They arranged spectral types in order from hottest to coolest based on the strength of Balmer lines in the hydrogen absorption spectrum.
The spectral type sequence
The spectral types were assigned letter names that form a sequence from hottest to coolest:
O, B, A, F, G, K, M
Memory aid: "Oh Be A Fine Guy/Girl Kiss Me"
This sequence may seem unusual because the letters are not in alphabetical order. This is because the original classification scheme used the alphabet, but when astronomers reorganized the system by temperature, only certain letter categories were retained.
The spectral type system
The table below shows the complete Harvard system of spectral types, including later additions of L and T types for the coolest objects. Each spectral type has characteristic properties:
| Spectral Type | Colour | Peak Wavelength (nm) | Surface Temperature (K) | Balmer Line Features | Other Spectral Features | Examples |
|---|---|---|---|---|---|---|
| O | blue | 72 | >30,000 | weak | Ionised He⁺ lines, strong UV continuum | Orionis C |
| B | light blue | 145 | 11,000–30,000 | medium | Neutral He lines | Achernar, Rigel, Spica |
| A | white | 290 | 7500–11,000 | strong | Strong H lines, ionised metal lines | Sirius, Vega |
| F | yellow-white | 380 | 6000–7500 | medium | Weak ionised Ca⁺ | Procyon, Canopus |
| G | yellow | 530 | 5000–6000 | medium | Ionised Ca⁺, metal lines | Sun, Capella |
| K | orange | 725 | 3500–5000 | very weak | Ca⁺, Fe, strong molecules (CH, CN) | Arcturus, Aldebaran |
| M | red | 960 | <3500 | very weak | Molecular lines (e.g. TiO), neutral metals | Betelgeuse, Antares |
| L | orange-brown | 1200 | <2700 | (–) | Ionised He⁺ lines, strong UV continuum | GD 165B |
| T | brown | 4000 | <900 | (–) | Neutral He lines | Gleise 229B |
Notice how the peak wavelength increases (shifts toward longer wavelengths) as temperature decreases. Hot O-type stars have peak wavelengths in the ultraviolet range (72 nm), while cool T-type stars peak in the infrared (4000 nm).
Our Sun as a G-type Star
Our Sun is classified as a G-type star with these key characteristics:
- Surface temperature: approximately 5500 K
- Colour: yellow
- Balmer line strength: medium
- Spectral features: ionised calcium (Ca⁺) and metal lines
- Peak wavelength: around 530 nm (green-yellow region of the spectrum)
This classification places the Sun in the middle range of stellar temperatures, making it neither particularly hot nor cool compared to other stars.
Additional classification systems
The Morgan-Keenan system
While the Harvard classification is widely used, other systems provide additional information. The Morgan-Keenan (MK) system is a multi-dimensional classification based on both temperature and luminosity.
In the MK system:
- Temperatures within a class are denoted by numbers from 0 (hottest) to 9 (coolest)
- Luminosities are denoted by Roman numerals: Ia, Ib, II, III, IV, and V
For example, our Sun's full MK classification is G2V, indicating it is a G-type star with temperature classification 2 (fairly hot within the G range) and luminosity class V.
Recent additions to classification
The development of infrared astronomy using satellite-based telescopes has allowed astronomers to observe stars previously too cool to classify with optical telescopes. These discoveries led to modifications of the spectral classification system:
- L and T types: Added for extremely cool objects (brown dwarfs) with temperatures below 2700 K and 900 K respectively
- R, N, and S types: Assigned to cool stars depending on specific elements present in their spectra
- WR (Wolf-Rayet) category: For unusual hot stars with specific spectral features
- T (T Tauri) category: For young stars still forming
Line width and stellar characteristics
Atmospheric pressure and star size
The thickness (width) of absorption lines visible in a star's spectrum provides important information about the pressure in the star's atmosphere. This relationship occurs because of differences in atmospheric density and gravitational acceleration.
Small, compact stars have:
- Relatively dense atmospheres
- Higher atmospheric pressure
- Higher gravitational acceleration at their surface
- Broader spectral lines
Large, giant stars have:
- Lower atmospheric pressure
- Lower gas density near their surfaces
- Narrower spectral lines
This might seem counterintuitive since giant stars have greater mass. However, their much greater radius means their surfaces are farther from the center. Since gravitational force follows an inverse-square relationship with distance, the gravitational force at the surface of a giant star is much weaker than at the surface of a compact star of similar mass.
White dwarf stars
A white dwarf is the remnant of a star in the final stages of cooling after its nuclear fuel has been depleted. These objects have unique characteristics:
- High surface temperature (maintaining white or blue-white color)
- Very dim despite high temperature
- Extremely small size (approximately the same as Earth)
- No longer fusing nuclei in their core
White dwarfs are fundamentally different from 'dwarf' and 'sub-dwarf' stars. Regular dwarf stars are simply stars with comparatively small sizes that are still actively fusing elements in their cores. White dwarfs represent the end stage of stellar evolution for low- to medium-mass stars.
Remember!
Key Points to Remember:
-
Fraunhofer lines are the absorption lines observed in the Sun's spectrum, named after Joseph Fraunhofer who first studied them systematically in 1814.
-
A star's colour is determined by its surface temperature: red stars are coolest (around 3500 K), blue stars are hottest (above 30,000 K).
-
The spectral sequence O B A F G K M runs from hottest to coolest. Remember: "Oh Be A Fine Guy/Girl Kiss Me".
-
Balmer lines (hydrogen absorption lines) are strongest in class A stars at approximately 10,000 K. They become weaker in both cooler and hotter stars. Very hot stars lack Balmer lines because hydrogen is completely ionized.
-
Line width in stellar spectra indicates atmospheric pressure and helps distinguish between compact stars (broad lines, high pressure) and giant stars (narrow lines, low pressure). This luminosity classification provides information beyond temperature alone.